Introduction to Data Interpretation
Direction: Study the following graph carefully and answer the questions given below.
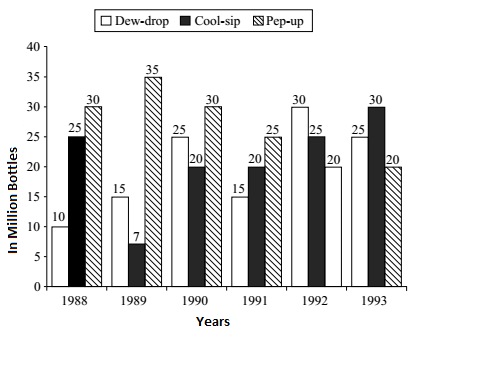
- In which year was the sale of ‘Pep-up’ the maximum?
-
View Hint View Answer Discuss in Forum
As per given graph we can compare the sale graph for Pep Up for all given years.
Correct Option: E
By comparing the Sale of Pep-up for all years and we found that the Sale of Pep-up was the maximum in the year 1989.
Direction: Study the following graph carefully to answer the questions given below it.
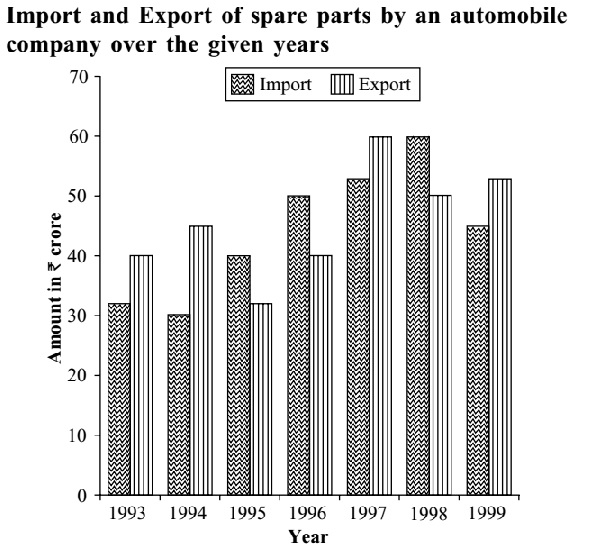
- What is the ratio of total imports to total exports for all the given years together?
-
View Hint View Answer Discuss in Forum
Total imports in the given years = 35 + 30 + 40 + 50 + 55 + 60 + 45 = 315 Million
Total exports in the given years = 40 + 45 + 35 + 40 + 60 + 50 + 55 = 325 MillionCorrect Option: D
Total imports in the given years = 35 + 30 + 40 + 50 + 55 + 60 + 45 = 315 Million
Total exports in the given years = 40 + 45 + 35 + 40 + 60 + 50 + 55 = 325 Million
Hence, required ratio =315 = 63 325 65
- The total exports in the years 1995, 1996 and 1999 together are what % of the total import during the same period? (up to two decimal places)
-
View Hint View Answer Discuss in Forum
Total exports in the years 1995, 1996 and 1999 = 35 + 40 + 55 = 130 Million
Total imports in the years 1995, 1996 and 1999 = 40 + 50 + 45 = 135 Million.Correct Option: E
Total exports in the years 1995, 1996 and 1999 = 35 + 40 + 55 = 130 Million
Total imports in the years 1995, 1996 and 1999 = 40 + 50 + 45 = 135 Million.Now, Required % = 130 X 100 = 96.29 % 135
- Which of the following pairs of years and the % increase in the export over the previous year is correctly matched?
-
View Hint View Answer Discuss in Forum
If you calculate approximate value you reject (b), (c) and (d).
Now check option (a).
In 1996 , calculate % increase in exportCorrect Option: A
If you calculate approximate value you reject (b), (c) and (d). Now check (a).
In 1996, % increase in export= 5 x 100 = 100 = 14.29% 35 7
- During which year the percentage rise/fall in imports from the previous year is the lowest?
-
View Hint View Answer Discuss in Forum
As per given graph we can see the difference is very less in 1998.
Correct Option: B
As per given graph we can see the difference is very less in 1998. Obvious from the chart its 1998 .

