Introduction to Data Interpretation
Direction: The following pie-chart shows the percentage distribution of the expenditure incurred in publishing a book. Read the pie-chart and answer the questions.

- If for a certain quantity of books, the publisher has to pay $ 30600 as printing cost, then the amount of royalty cost to be paid for these books is :
-
View Hint View Answer Discuss in Forum
According to given pie chart in question ,
Percentage of printing cost = 20%
Percentage of Royalty cost = 15%
Printing cost = $ 30600
∵ 20% ≡ $ 30600∴ 1% ≡ 30600 20 ∴ Required paid amount = Printing cost × Percentage of Royalty cost Percentage of printing cost
Correct Option: C
According to given pie chart in question ,
Percentage of printing cost = 20%
Percentage of Royalty cost = 15%
Printing cost = $ 30600
∵ 20% ≡ $ 30600∴ 1% ≡ 30600 20 ∴ Required paid amount = Printing cost × Percentage of Royalty cost Percentage of printing cost ∴ Required paid amount = 30600 × 15 = $ 22950 20
- If 5500 copies are published and the transportation cost on them amount to $ 82500 then the selling price of the book so that the publisher can earn a profit of 25% is :
-
View Hint View Answer Discuss in Forum
As per the given pie chart in question ,
Total number of published copies = 5500
Transportation cost = 10%
Transportation cost = $ 82500
∵ 10% ≡ $ 82500
∴ 100% ≡ $ 825000∴ Cost for publishing 1 book = 825000 = $ 150 5500
Correct Option: B
As per the given pie chart in question ,
Total number of published copies = 5500
Transportation cost = 10%
Transportation cost = $ 82500
∵ 10% ≡ $ 82500
∴ 100% ≡ $ 825000∴ Cost for publishing 1 book = 825000 = $ 150 5500
For a profit of 25% ,∴ Required S.P. = 150 × 125 = $ 187.50 100
- The central angle of the sector corresponding to the expenditure incurred on Royalty is :
-
View Hint View Answer Discuss in Forum
On the basis of given pie chart in question ,
Percentage expense on royalty = 15%
Percent of total expenditure = 100%
Corresponding angle for total expenditure = 360°
∵ 100% ≡ 360°∴ Required angle = Corresponding angle for total expenditure × Percentage expense on royalty = 54° Percent of total expenditure
Correct Option: C
On the basis of given pie chart in question ,
Percentage expense on royalty = 15%
Percent of total expenditure = 100%
Corresponding angle for total expenditure = 360°
∵ 100% ≡ 360°∴ Required angle = Corresponding angle for total expenditure × Percentage expense on royalty = 54° Percent of total expenditure ∴ Required angle = 360 × 15 = 54° 100
- Royalty on the book is less than the printing cost by :
-
View Hint View Answer Discuss in Forum
According to given pie chart in question ,
Percent of royalty cost = 20%
Percent of printing cost = 15%
Change in cost = 20 - 15 = 5%Required percent = 
Change in cost × 100 
% Percent of royalty cost
Correct Option: C
According to given pie chart in question ,
Percent of royalty cost = 20%
Percent of printing cost = 15%
Change in cost = 20 - 15 = 5%Required percent = Change in cost × 100 % Percent of royalty cost Required percent = 20 - 15 × 100 % 20 Required percent = 5 × 100 % = 25% 20
Direction: Study the pie chart and answer the given questions. The total expenditure of a company for a particular month is Rs. 60000. The various heads of expenditure I to IV are indicated in a pie chart given below. These heads are :
I. Raw materials
II. Conveyance
III. Electricity
IV. Overhead expenses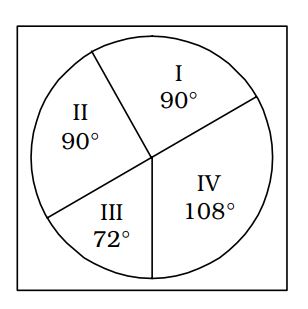
- What percentage of total expenditure is on raw materials?
-
View Hint View Answer Discuss in Forum
On the basis of given pie chart in question ,
Corresponding angle for raw materials = 90°
Percent of total expenditure = 100%
Corresponding angle for total expenditure = 360°
we know that , 360° ≡ 100%Correct Option: A
On the basis of given pie chart in question ,
Corresponding angle for raw materials = 90°
Percent of total expenditure = 100%
Corresponding angle for total expenditure = 360°
we know that , 360° ≡ 100%∴ Required percent = 90° ≡ 100 × 90 = 25% 360

