Introduction to Data Interpretation
Direction: The table given below shows production of five types of cars by a company from the year 1998 to 2003. Study the table and answer the question.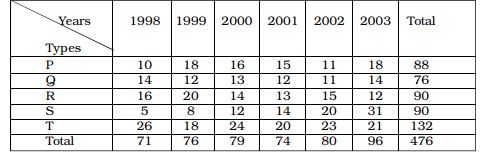
- In which year the production of cars of all types taken together was approximately equal to the average of the total production during the period:
-
View Hint View Answer Discuss in Forum
On the basis of given table in question ,
Total production of cars of all types taken together = 476
Number of given years = 6Average production of whole duration = Total production of cars of all types taken together Number of given years
Correct Option: B
On the basis of given table in question ,
Total production of cars of all types taken together = 476
Number of given years = 6Average production of whole duration = Total production of cars of all types taken together Number of given years Average production of whole duration = 476 = 79 6
which is total production in 2000.
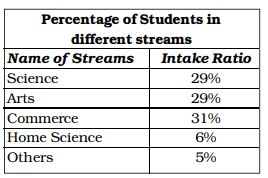
- Different choices made by a group of 200 students are given below in percentage. The number of students who have taken neither Science nor Commerce is
-
View Hint View Answer Discuss in Forum
According to given table, we have
Percentage of students in ( Science + Commerce ) = (29 + 31)% = 60%
Percentage of students in ( Arts + Home science + Others ) = (29 + 6 + 5)% = 40%
Percentage of students in all streams = 100%Correct Option: A
According to given table, we have
Percentage of students in ( Science + Commerce ) = (29 + 31)% = 60%
Percentage of students in ( Arts + Home science + Others ) = (29 + 6 + 5)% = 40%
Percentage of students in all streams = 100%Students who neither have commerce nor science = 200 × 40 = 80 100
Direction: The following table shows the production of food grains (in million tonnes) in a State for the period 1988 to 1992. Read the table and answer the following questions.

- During 1992, the percentage of increase in the production of wheat, over the previous year was:
-
View Hint View Answer Discuss in Forum
On the basis of given table in question ,
Production of wheat in 1992 = 860 million tonnes
Production of wheat in 1991 = 680 million tonnes
Increase in production = 860 - 680 = 180 million tonnesPercentage increase = Increase in production × 100 Production of wheat in 1991
Correct Option: A
On the basis of given table in question ,
Production of wheat in 1992 = 860 million tonnes
Production of wheat in 1991 = 680 million tonnes
Increase in production = 860 - 680 = 180 million tonnesPercentage increase = Increase in production × 100 Production of wheat in 1991 Percentage increase = 180 × 100 = 26.47% 680
- The increase in the production of other cereals (over the previous year) was minimum during the year :
-
View Hint View Answer Discuss in Forum
As per the given above table , we see
Production of other cereals in 1988 = 350 million tonnes
Production of other cereals in 1989 = 400 million tonnes
Increase in production = 400 - 350 = 50 million tonnesPercentage increase in 1988 = 50 × 100 = 14.28% 350
Similarly , we can find other values .Correct Option: A
As per the given above table , we see
Production of other cereals in 1988 = 350 million tonnes
Production of other cereals in 1989 = 400 million tonnes
Increase in production = 400 - 350 = 50 million tonnesPercentage increase in 1988 = 50 × 100 = 14.28% 350
Production of other cereals in 1989 = 400 million tonnes
Production of other cereals in 1990 = 420 million tonnes
Increase in production = 420 - 400 = 20 million tonnesPercentage increase in 1989 = 20 × 100 = 5% 400
Hence , required answer is 1989 year .
- In 1991, the increase in production over the previous year was maximum for :
-
View Hint View Answer Discuss in Forum
On the basis of given table in question ,
Production of wheat in 1990 = 560 million tonnes
Production of wheat in 1991 = 680 million tonnes
Increase in production = 680 - 560 = 120 million tonnesPercentage increase = 120 × 100 = 21.42% 560
Production of rice in 1990 = 240 million tonnes
Production of rice in 1991 = 300 million tonnes
Increase in production = 300 - 240 = 60 million tonnesPercentage increase = 60 × 100 = 25% 240
Correct Option: C
On the basis of given table in question ,
Production of wheat in 1990 = 560 million tonnes
Production of wheat in 1991 = 680 million tonnes
Increase in production = 680 - 560 = 120 million tonnesPercentage increase = 120 × 100 = 21.42% 560
Production of rice in 1990 = 240 million tonnes
Production of rice in 1991 = 300 million tonnes
Increase in production = 300 - 240 = 60 million tonnesPercentage increase = 60 × 100 = 25% 240
Production of maize in 1990 = 228 million tonnes
Production of maize in 1991 = 380 million tonnes
Increase in production = 380 - 228 = 52 million tonnesPercentage increase = 52 × 100 = 22.80% 228
From above it is clear that increase in production for maize is maximum.

