Introduction to Data Interpretation
Direction: Study the following graph and answer the questions.

- If the imports of company X in 2007 were increased by 40%, what would be the ratio of exports to the increased imports?
-
View Hint View Answer Discuss in Forum
On the basis of given graph in question ,
Exports = 1.75 Imports = 175 = 7 100 4
Correct Option: A
On the basis of given graph in question ,
Exports = 1.75 Imports = 175 = 7 100 4 After 40% increase in imports, Exports = 7 = 700 Imports (4 × 140) / 100 4 × 140 Required ratio = 5 = 1.25 4
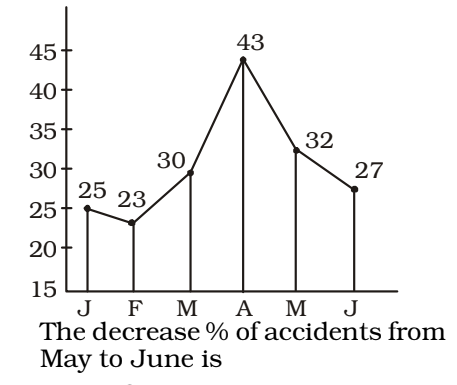
- Given is a line graph showing the number of accidents in a city during the first 6 months of 1999.
-
View Hint View Answer Discuss in Forum
According to given graph in question ,
Percentage decrease = 32 - 27 × 100 32
Correct Option: C
According to given graph in question ,
Percentage decrease = 32 - 27 × 100 32 Percentage decrease = 5 × 100 = 125 = 15 5 % 32 8 8
- The adjoining diagram is frequency polygon for the scores of students in a test. What is the total number of students appeared in the test?

-
View Hint View Answer Discuss in Forum
As per the given graph in question ,
Number of students = 15 + 30 + 35 + 30 + 25 + 22.5 + 22.5 = 180Correct Option: A
As per the given graph in question ,
Number of students = 15 + 30 + 35 + 30 + 25 + 22.5 + 22.5 = 180
Hence , the total number of students appeared in the test is 180 .
Direction: Study the following graph and answer the questions.

- If the income shows positive growth every year throughout the period (2000 - 2005), then in how many years the expenditure shows a positive growth?
-
View Hint View Answer Discuss in Forum
It is obvious from the graph.
Correct Option: D
It is obvious from the graph.
Hence , required answer is 2 .
- Find the percentage decrease in income from 2001 to 2002.
-
View Hint View Answer Discuss in Forum
Definite income is not known.
Correct Option: D
Definite income is not known.
Hence , Data is not sufficient for solve this question .

