Introduction to Data Interpretation
Direction: Study the following graph carefully to answer the questions given below it.
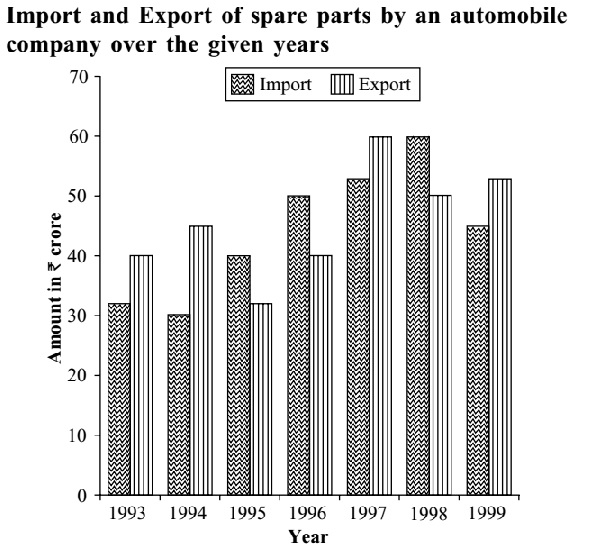
- In which of the following pairs of years the total import is equal to total export in the same pair of years?
-
View Hint View Answer Discuss in Forum
See the chart and compare the graph.
Correct Option: C
Obvious from the chart , we can say that 1998–1999 year has the same import and export.
Direction: Study the following table carefully and answer the question given below it.
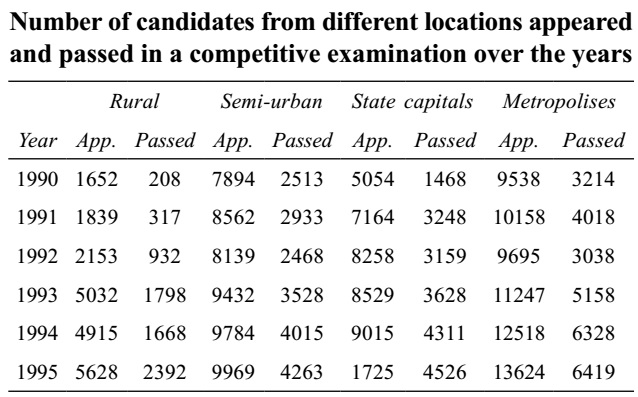
- For the candidates from which of the following locations was there continuous increase both in appeared and passed?
-
View Hint View Answer Discuss in Forum
As we can see in the graph that metropolises location has continuous increase both in appeared and passed.
Correct Option: D
As we can see in the graph that metropolises location has continuous increase both in appeared and passed.
- In which of the following years was the percentage passed to appeared candidates from semi-urban area the least?
-
View Hint View Answer Discuss in Forum
Our intelligent observation says that the required year cannot be 1993, 1994, 1995. Why? Because see the following conclusions:
% passed to appear = Passed / Appeared x 100
% of passed to appear is least when Passed / Appeared is the least or, Appeared / Passed is the most.Correct Option: C
Our intelligent observation says that the required year cannot be 1993, 1994, 1995. Why? Because see the following conclusions:
% passed to appear = Passed / Appeared x 100
% of passed to appear is least when Passed / Appeared is the least or, Appeared / Passed is the most.
Now, we do the further calculations mentally. See the following conclusions:
For 1990: 7894 / 2513 ⇒ Quotient = 3 and Remainder ≈ 300
For 1991: 8562 / 2933 ⇒ Q = 3 and R ≈ 400
For 1992: 8139 / 2468 ⇒ Q = 3 and R ≈ 800
Similarly, for 1993; 1994, 1995, Q is 2.
So, 1992 gives the highest value.
- What approximate value was the percentage drop in the number of semi-urban candidates appeared from 1991 to 1992?
-
View Hint View Answer Discuss in Forum
Percentage drop = Semi-urban candidates appeared in 1991 - Semi-urban candidates appeared in 1992 × 100 Number of semi-urban candidates appeared in 1991 Correct Option: A
Percentage drop = Semi-urban candidates appeared in 1991 - Semi-urban candidates appeared in 1992 × 100 Number of semi-urban candidates appeared in 1991 8562 - 8139 × 100 = 423 × 100 ≈ 42 × 10 = 5 % 8562 8562 84
- In 1993 percentage of candidates passed to appeared was approximately 35 from which location?
-
View Hint View Answer Discuss in Forum
We do not need to calculate the values for each year.
Follow as :
For Rural area : 35% of 5032 ≈ 35 × 50 = 1750 ≈ 1798
For Semi-urban area: 35% of 9500 ≈ 35 × 95 ≈ 3300Correct Option: E
We do not need to calculate the values for each year.
Follow as:
For Rural area : 35% of 5032 ≈ 35 × 50 = 1750 ≈ 1798
For Semi-urban area : 35% of 9500 ≈ 35 × 95 ≈ 3300
Which cannot be approximated to 3500.
For State capitals : 35 × 85 = 3000
For Metropolises : 35 × 110 = 3850

