Introduction to Data Interpretation
Direction: The following bar diagram shows the percentage of Hindus, Sikhs and Muslims in a state during the years from 2004 to 2007. Examine the bar diagram and answer the following questions.

- If the total population of the state in 2005 was 5 million, then the Hindu population was [1 million = 10,00,000]
-
View Hint View Answer Discuss in Forum
On the basis of given graph in question ,
Total population of the state in 2005 = 5 million
Percent of the Hindu population in 2005 = 35%
The Hindu population in 2005 = 35% of 5 millionCorrect Option: D
On the basis of given graph in question ,
Total population of the state in 2005 = 5 million
Percent of the Hindu population in 2005 = 35%
The Hindu population in 2005 = 35% of 5 millionHindus = 5000000 × 35 = 1750000 100
Direction: Study the following graph carefully and answer the questions given below it.
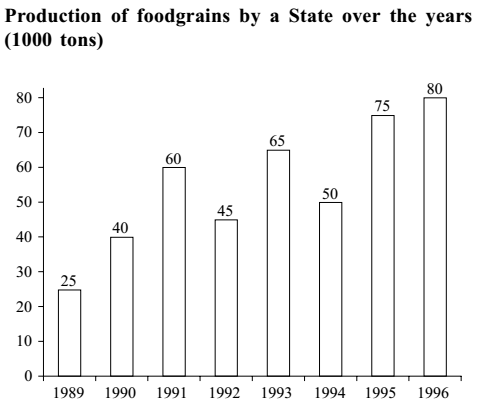
- The average production of 1990 and 1991 was exactly equal to the average production of which of the following pairs of years?
-
View Hint View Answer Discuss in Forum
As per given graph in question,
The average production of 1990 and 1991 = (40 + 60)/2 = 100/2 = 50
try to solve all given option one by one.Correct Option: E
As per given graph in question,
The average production of 1990 and 1991 = (40 + 60)/2 = 100/2 = 50
The average production of 1991 = 60
Solve one by one option.
(A) The average production of 1991 and 1992 = (60 + 45)/2 = 105/2 = 52.5
(B) The average production of 1992 and 1994 = (45 + 50)/2 = 95/2 = 47.5
(C) The average production of 1993 and 1994 = (65 + 50)/2 = 115/2 = 57.5
(D) The average production of 1994 and 1995 = (50 + 75)/2 = 125/2 = 62.5
All the given option doesn't have average production of 50. So answer will be none of these.
- What was the difference in the production of food-grains between 1991 and 1994?
-
View Hint View Answer Discuss in Forum
Difference in the production of food-grains between 1991 and 1994 = Production of food-grains in 1991 - Production of food-grains in 1994
Correct Option: A
Difference in the production of food-grains between 1991 and 1994 = Production of food-grains in 1991 - Production of food-grains in 1994
Put the value by seeing the graph
Difference in the production of food-grains between 1991 and 1994 = ( 60 − 50 ) x 1000 = 10 x 1000 = 10,000
- In which of the following years was the percentage increase in production from the previous year the maximum among the given years?
-
View Hint View Answer Discuss in Forum
Check given option one by one.
Option (A),
Percentage increase in production in 1991 = {(Production in 1991 - Production in 1990)} x 100 % / Production in 1990
Percentage increase in production in 1991 = {( 60 - 40 )} x 100 % / 40
Percentage increase in production in 1991 = 20 x 100 % / 40
Percentage increase in production in 1991 = 100 % / 2 = 50 %Correct Option: D
Check given option one by one.
Option (A),
Percentage increase in production in 1991 = {(Production in 1991 - Production in 1990)} x 100 % / Production in 1990
Percentage increase in production in 1991 = {( 60 - 40 )} x 100 % / 40
Percentage increase in production in 1991 = 20 x 100 % / 40
Percentage increase in production in 1991 = 100 % / 2 = 50 %
Option (B)
Percentage increase in production in 1993 = {( Production in 1993 - Production in 1992 )} x 100 % / Production in 1992
Percentage increase in production in 1993 = {( 65 - 45 )} x 100 % / 45
Percentage increase in production in 1993 = 20 x 100 % / 45
Percentage increase in production in 1993 = 4 x 100 % / 9 = 400/9 = 44.44 %
Option (C)
Percentage increase in production in 1995 = {( Production in 1995 - Production in 1994 )} x 100 % / Production in 1994
Percentage increase in production in 1995 = {( 75 - 50 )} x 100 % / 50
Percentage increase in production in 1995 = 25 x 100 % / 50
Percentage increase in production in 1995 = 100 % / 2 =50 %
Option (D)
Percentage increase in production in 1990 = {( Production in 1990 - Production in 1989 )} x 100 % / Production in 1989
Percentage increase in production in 1990 = {( 40 - 25)} x 100 % / 25
Percentage increase in production in 1990 = 15 x 100 % / 25
Percentage increase in production in 1990 = 15 x 4 % = 60 %
- What was the percentage drop in the production of food-grains from 1991 to 1992?
-
View Hint View Answer Discuss in Forum
Required percentage drop = Percentage decrease in production in 1991 to 1992 = {(Production in 1992 - Production in 1991)} x 100 % / Production in 1991
Correct Option: C
Required percentage drop = Percentage decrease in production in 1991 to 1992 = {( Production in 1992 - Production in 1991 )} x 100 % / Production in 1991
= 60 - 45 X 100 = 25 % 60

