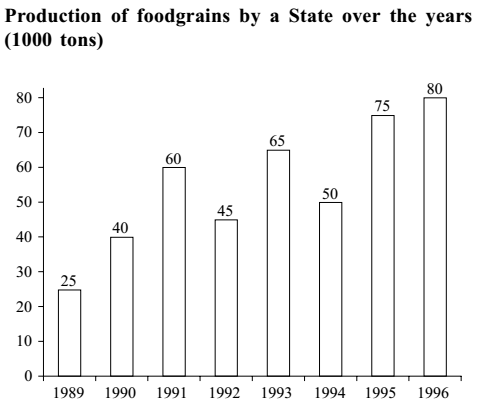
Direction: Study the following graph carefully and answer the questions given below it.
-
What was the percentage drop in the production of food-grains from 1991 to 1992?
-
- 15
- 20
- 25
- 30
- None of these
Correct Option: C
Required percentage drop = Percentage decrease in production in 1991 to 1992 = {( Production in 1992 - Production in 1991 )} x 100 % / Production in 1991
| = | 60 - 45 | X | 100 | = | 25 | % | 60 |

