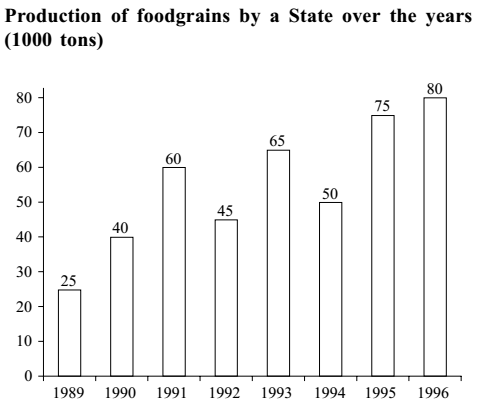
Direction: Study the following graph carefully and answer the questions given below it.
-
In which of the following years was the percentage increase in production from the previous year the maximum among the given years?
-
- 1991
- 1993
- 1995
- 1990
- None of these
Correct Option: D
Check given option one by one.
Option (A),
Percentage increase in production in 1991 = {(Production in 1991 - Production in 1990)} x 100 % / Production in 1990
Percentage increase in production in 1991 = {( 60 - 40 )} x 100 % / 40
Percentage increase in production in 1991 = 20 x 100 % / 40
Percentage increase in production in 1991 = 100 % / 2 = 50 %
Option (B)
Percentage increase in production in 1993 = {( Production in 1993 - Production in 1992 )} x 100 % / Production in 1992
Percentage increase in production in 1993 = {( 65 - 45 )} x 100 % / 45
Percentage increase in production in 1993 = 20 x 100 % / 45
Percentage increase in production in 1993 = 4 x 100 % / 9 = 400/9 = 44.44 %
Option (C)
Percentage increase in production in 1995 = {( Production in 1995 - Production in 1994 )} x 100 % / Production in 1994
Percentage increase in production in 1995 = {( 75 - 50 )} x 100 % / 50
Percentage increase in production in 1995 = 25 x 100 % / 50
Percentage increase in production in 1995 = 100 % / 2 =50 %
Option (D)
Percentage increase in production in 1990 = {( Production in 1990 - Production in 1989 )} x 100 % / Production in 1989
Percentage increase in production in 1990 = {( 40 - 25)} x 100 % / 25
Percentage increase in production in 1990 = 15 x 100 % / 25
Percentage increase in production in 1990 = 15 x 4 % = 60 %

