Direction: Study the following graph carefully and answer the questions given below it.
-
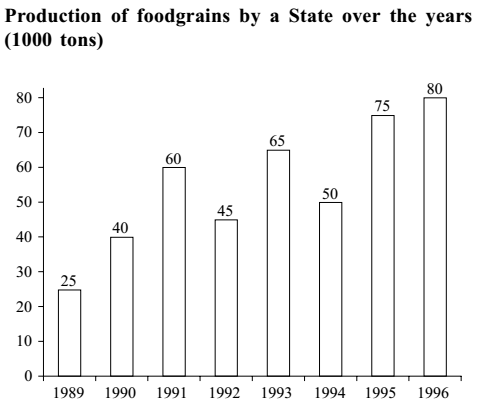
In how many of the given years was the production of foodgrains more than average production of the given years?
-
- 2
- 3
- 4
- 1
- None of these
Correct Option: C
Average production
| = | 15 | + | 40 | + | 60 | + | 45 | + | 65 | + | 50 | + | 70 | + | 80 |
| 8 | |||||||||||||||
| = | 440 | = | 55 | . |
| 8 |
The average production of the year is 55 and as we are seeing in the graph that the year 1991, 1993, 1995, 1996 have more than the 55.

