Introduction to Data Interpretation
Direction: Study the following graph carefully and answer the questions given below it.
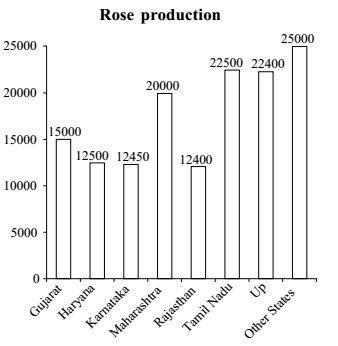
- Approximately what percentage of the total rose production is shared by the other States?
-
View Hint View Answer Discuss in Forum
Required percentage
= 25 X 100 ≈ 20% 142.25
Correct Option: B
Required percentage
= 25 X 100 ≈ 20% 142.25
Direction: Study the following graph carefully and answer the questions given below.
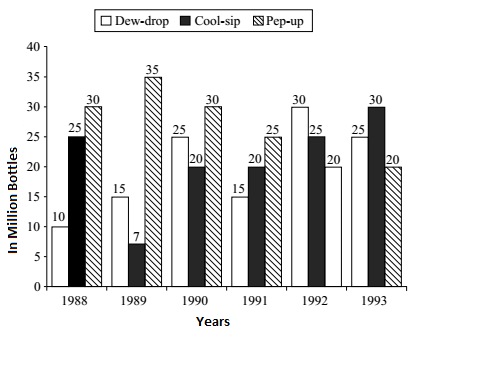
- What was the approximate % drop in sale of Pep-up in 1990 over its sale in 1989?
-
View Hint View Answer Discuss in Forum
Required % drop = Number of sale of Pep-up in 1989 - Number of sale of Pep-up in 1990 X 100 Number of sale of Pep-up in 1989 Correct Option: C
Required % drop = Number of sale of Pep-up in 1989 - Number of sale of Pep-up in 1990 X 100 Number of sale of Pep-up in 1989 Required % drop = 35 - 30 X 100 ≈ 14% 35
- In the year 1990, what was the difference between the number of ‘Pep-up’ and ‘Cool-sip’ bottles sold?
-
View Hint View Answer Discuss in Forum
Difference in Required number = Number of Pep-up drink sold in 1990 - Number of Cool-sip drink sold in 1990.
Correct Option: E
Difference in Required number = Number of Pep-up drink sold in 1990 - Number of Cool-sip drink sold in 1990.
Difference in Required number = 30 million − 20 million = 10 million.
Difference in Required number = 10 million = 10 x 1000000 ( Since 1 million = 1000000 )
Difference in Required number = 10 million = 10000000
- In the case of Cool-sip drink, what was the approximate % increase in sale in 1992 over its sale in 1991?
-
View Hint View Answer Discuss in Forum
Required % = ( Number of Cool-sip drink in 1992 - Number of Cool-sip drink in 1991 ) X 100 Number of Cool-sip drink in 1991
Correct Option: C
Required % = ( Number of Cool-sip drink in 1992 - Number of Cool-sip drink in 1991 ) X 100 Number of Cool-sip drink in 1991 Required % = 25 - 20 X 100 = 25% 20
- In the case of which soft drink was the average annual sale maximum in the given period?
-
View Hint View Answer Discuss in Forum
Avg. annual sale of Dew-drop
= 10 + 15 + 25 + 15 + 30 + 25 = 20 Million 6
Similarly calculate for the other drinks also.Correct Option: A
Avg. annual sale of Dew-drop
= 10 + 15 + 25 + 15 + 30 + 25 = 20 Million 6
Average anual sale of Cool-sip= 25 + 7 + 2C + 20 + 25 + 30 = 21.16 Million 6
Average annual sale of Pep-up= 30 + 35 + 30 + 25 + 30 = 26.66 Million 6

