Direction: Study the following graph carefully and answer the questions given below.
-
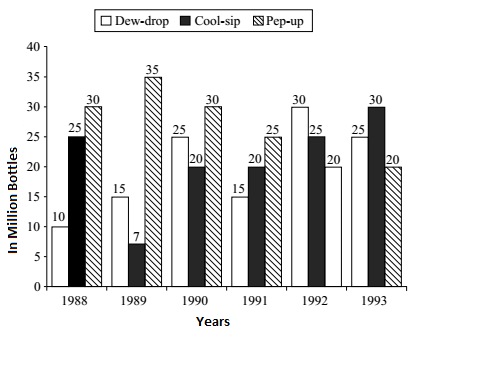
In the case of Cool-sip drink, what was the approximate % increase in sale in 1992 over its sale in 1991?
-
- Less then 20
- 20 - 25
- 25
- 31 - 35
- 36 - 40
Correct Option: C
| Required % = | ( Number of Cool-sip drink in 1992 - Number of Cool-sip drink in 1991 ) | X | 100 |
| Number of Cool-sip drink in 1991 |
| Required % = | 25 - 20 | X | 100 | = 25% |
| 20 |

