Direction: Study the following graph carefully and answer the questions given below.
-
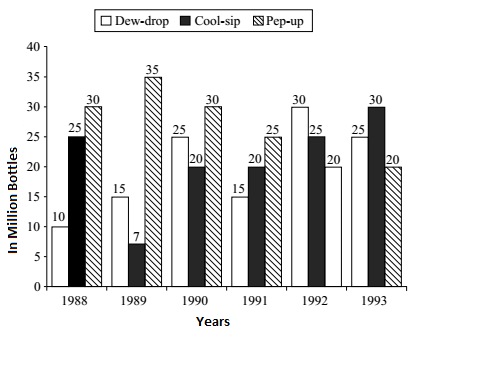
In the case of which soft drink was the average annual sale maximum in the given period?
-
- Pep-up only
- Cool-sip only
- Dew-drop only
- Cool -sip and Dew-drop
- Pep-up and Dew-drop
Correct Option: A
Avg. annual sale of Dew-drop
| = | 10 + 15 + 25 + 15 + 30 + 25 | = 20 Million |
| 6 | ||
Average anual sale of Cool-sip
| = | 25 + 7 + 2C + 20 + 25 + 30 | = 21.16 Million |
| 6 | ||
Average annual sale of Pep-up
| = | 30 + 35 + 30 + 25 + 30 | = 26.66 Million |
| 6 | ||

