Direction: Study the following graph carefully and answer the questions given below.
-
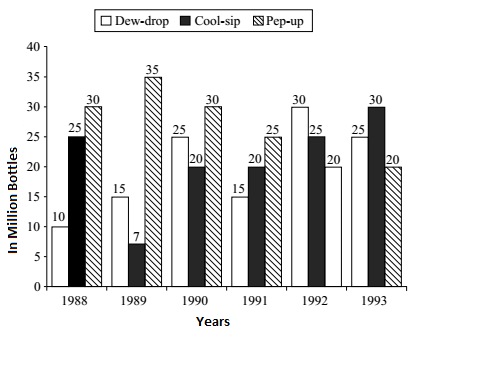
In which year was the sale of ‘Pep-up’ the maximum?
-
- 1990
- 1991
- 1992
- 1993
- None of these
Correct Option: E
By comparing the Sale of Pep-up for all years and we found that the Sale of Pep-up was the maximum in the year 1989.

