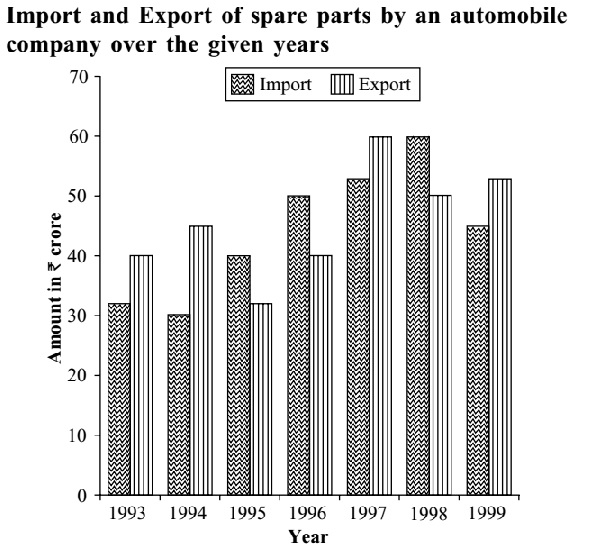
Direction: Study the following graph carefully to answer the questions given below it.
-
What is the ratio of total imports to total exports for all the given years together?
-
- 31 : 35
- 35 : 31
- 65 : 63
- 63 : 65
- None of these
Correct Option: D
Total imports in the given years = 35 + 30 + 40 + 50 + 55 + 60 + 45 = 315 Million
Total exports in the given years = 40 + 45 + 35 + 40 + 60 + 50 + 55 = 325 Million
Hence, required ratio =
| 315 | = | 63 |
| 325 | 65 |

