Direction: Study the following graph carefully to answer the questions given below it.
-
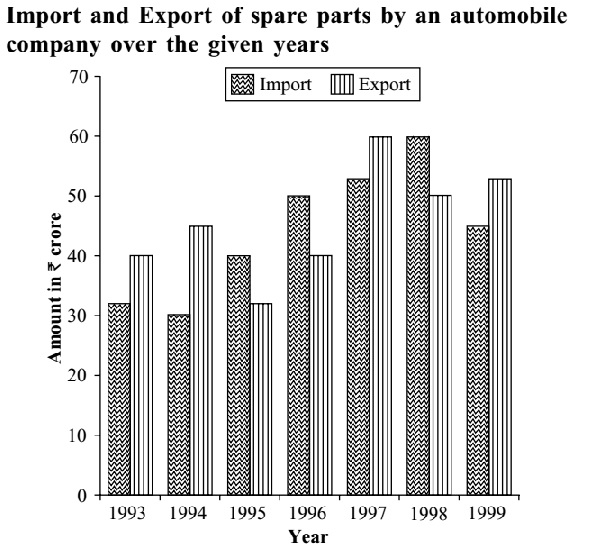
The total exports in the years 1995, 1996 and 1999 together are what % of the total import during the same period? (up to two decimal places)
-
- 107.41
- 107.14
- 93.33
- 93.67
- None of these
Correct Option: E
Total exports in the years 1995, 1996 and 1999 = 35 + 40 + 55 = 130 Million
Total imports in the years 1995, 1996 and 1999 = 40 + 50 + 45 = 135 Million.
| Now, Required % = | 130 X 100 | = | 96.29 | % |
| 135 |

