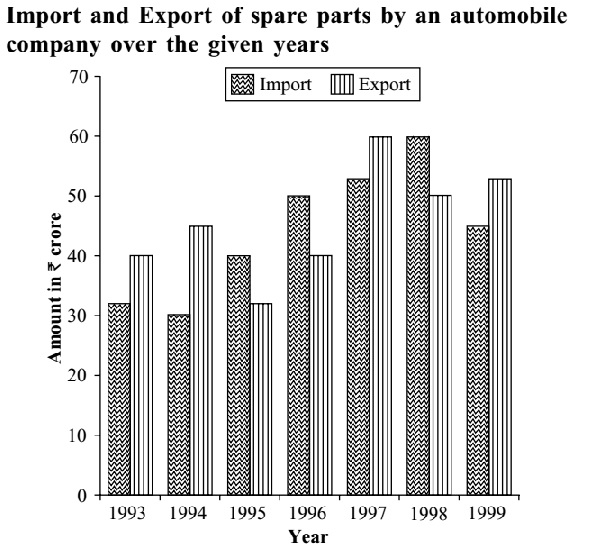
Direction: Study the following graph carefully to answer the questions given below it.
-
Which of the following pairs of years and the % increase in the export over the previous year is correctly matched?
-
- 1996 - 14.29
- 1997 - 10
- 1995 - 33.33
- 1994 - 11.11
- None of these
Correct Option: A
If you calculate approximate value you reject (b), (c) and (d). Now check (a).
In 1996, % increase in export
| = | 5 | x 100 = | 100 | = 14.29% |
| 35 | 7 |

