Introduction to Data Interpretation
Direction: The table given here shows production of five types of cars by a company in the year 1989 to 1994. Study the table and answer questions.

- The percent increased in total production of all types of cars in 1992 to that in 1991 was :
-
View Hint View Answer Discuss in Forum
As per the given above table , we can see
Total production of all types of cars in 1992 = 90
Total production of all types of cars in 1991 = 75
Increase in production = 90 - 75 = 15Required answer = Increase in production × 100 =% Total production of all types of cars in 1991
Correct Option: B
As per the given above table , we can see
Total production of all types of cars in 1992 = 90
Total production of all types of cars in 1991 = 75
Increase in production = 90 - 75 = 15Required answer = Increase in production × 100 =% Total production of all types of cars in 1991 Required answer = 15 × 100 = 20% 75
- The production of which type of car was 25% of the total production of all types of cars during 1993?
-
View Hint View Answer Discuss in Forum
On the basis of given table in question ,
Total production of all types of cars during 1993 = 80
According to question,25% of 80 = 25 × 80 100
Correct Option: A
On the basis of given table in question ,
Total production of all types of cars during 1993 = 80
According to question,25% of 80 = 25 × 80 = 20 i.e. Equal to S type of car in 1993. 100
- During the period 1989-94, in which type of cars was a continuous increase in production?
-
View Hint View Answer Discuss in Forum
According to given table, we can see
The production of car of S type in 1989 = 4
The production of car of S type in 1990 = 6
The production of car of S type in 1991 = 10
The production of car of S type in 1992 = 16
The production of car of S type in 1993 = 20
The production of car of S type in 1994 = 31Correct Option: D
According to given table, we can see
The production of car of S type in 1989 = 4
The production of car of S type in 1990 = 6
The production of car of S type in 1991 = 10
The production of car of S type in 1992 = 16
The production of car of S type in 1993 = 20
The production of car of S type in 1994 = 31
From visual inspection of table it is clear that the continuous increase in production is obtained from S type of car.
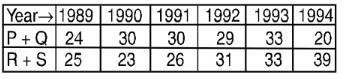
- In which year the total production of cars of types P and Q together was equal to the total production of cars of types R and S together?
-
View Hint View Answer Discuss in Forum
As per the given question , we draw a table with all details
Correct Option: D
As per the given question , we draw a table with all details
Therefore, the required answer is year 1993, which is none of the above. So , option D is correct answer .
- In which year the production of cars of all types taken together was approximately equal to the average of the total production during the period?
-
View Hint View Answer Discuss in Forum
According to given table, we have
Total production of cars of all types taken together in given years = 476
Number of given years = 6Average = Total production of cars of all types taken together in given years Number of given years
Correct Option: C
According to given table, we have
Total production of cars of all types taken together in given years = 476
Number of given years = 6Average = Total production of cars of all types taken together in given years Number of given years Average = 476 = 79.33 ≈ 80 6
Which is equal to total production of all types of cars in 1993.

