Introduction to Data Interpretation
Direction: Study the following table carefully and answer the questions given below it.
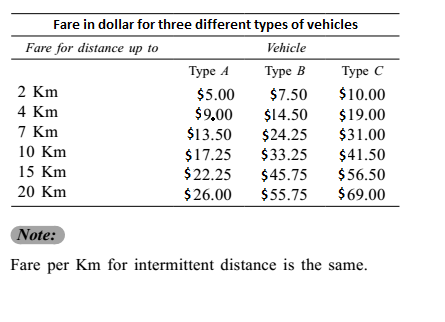
- Mr X wants to travel a distance of 8 Km by Type A vehicle. How much more money will be required to be spent if he decides to travel by Type B vehicle instead of Type A?
-
View Hint View Answer Discuss in Forum
∴ Difference = Fare by B − Fare by A
Correct Option: B
Fare, for 8 Km by A = 13.50 + 17.25 - 13.50 = 13.50 + 3.75 = $ 14.75 10 - 7 3 Fare by B = 24.25 + 33.25 - 24.25 = $ 27.25 3
∴ Difference = Fare by B − Fare by A
Difference = 27.25 − 14.75 = $ 12.50.
Direction: The pie- chart given below shows expenditure incurred by a family on various items and their savings. Study the chart and answer the questions based on the pie- chart

- If the monthly income is $ 36000, then the yearly savings is :
-
View Hint View Answer Discuss in Forum
∵ 360° ≡ $ 36000
∴ 1° ≡ 36000 = $ 100 360
∴ 60° ≡ 60 × 100 = $ 6000
∴ Annual savings = $ (6000 × 12)
= $ 72000Correct Option: B
∵ 360° ≡ $ 36000
∴ 1° ≡ 36000 = $ 100 360
∴ 60° ≡ 60 × 100 = $ 6000
∴ Annual savings = $ (6000 × 12)
= $ 72000
- If the expenditure on education is $ 1600 more than that on housing, then the expenditure on food is :
-
View Hint View Answer Discuss in Forum
∵ 70° – 54° ≡ $ 1600
∵ 16° ≡ $ 1600∴ 1° ≡ 1600 = $ 100 16
∴ 120° ≡ 120 × 100
= $ 12000Correct Option: A
∵ 70° – 54° ≡ $ 1600
∵ 16° ≡ $ 1600∴ 1° ≡ 1600 = $ 100 16
∴ 120° ≡ 120 × 100
= $ 12000
- The ratio of expenditure on food to savings is :
-
View Hint View Answer Discuss in Forum
Expenditure on food : savings
= 120° : 60° = 2 : 1Correct Option: D
Expenditure on food : savings
= 120° : 60° = 2 : 1
Direction: The following pie-chart shows the sources of funds (In $ billion) to be collected by the National Highways Authority of India (NHAI) for its Phase II projects. Study the pie-chart and answer the following Three questions :

- The central angle corresponding to Market Borrowing is
-
View Hint View Answer Discuss in Forum
Total funds = Rs. (11486 + 5252 + 4910 + 6000 + 29952) billion
= $ 57600 billion
$ 57600 ≡ 360°∴ 29952 ≡ 360 × 29952 57600
= 187.2°Correct Option: C
Total funds = Rs. (11486 + 5252 + 4910 + 6000 + 29952) billion
= $ 57600 billion
$ 57600 ≡ 360°∴ 29952 ≡ 360 × 29952 57600
= 187.2°

