Introduction to Data Interpretation
Direction: Study the pie-chart and table given below and answer the questions.

- The percentage of females working in IT department to the total number of employees working in the organization is
-
View Hint View Answer Discuss in Forum
Number of employees in IT department
= 800 × 20 = 160 100
Number of females
= 160 – 74 = 86
∴ Required percentage= 86 × 100 800
= 10.75Correct Option: B
Number of employees in IT department
= 800 × 20 = 160 100
Number of females
= 160 – 74 = 86
∴ Required percentage= 86 × 100 800
= 10.75
- The percentage of the number of male employees working in Marketing department to the total number of employees in Marketing department is
-
View Hint View Answer Discuss in Forum
Number of employees in Marketing department
= 800 × 24 = 192 100
∴ Required percentage= 165 × 100 = 86 192 Correct Option: B
Number of employees in Marketing department
= 800 × 24 = 192 100
∴ Required percentage= 165 × 100 = 86 192
- The respective ratio between the number of females working in HR department to the total number of employees working in the HR department is
-
View Hint View Answer Discuss in Forum
Number of employees in HR department
= 800 × 5 = 40 100 Correct Option: A
Number of employees in HR department
= 800 × 5 = 40 100
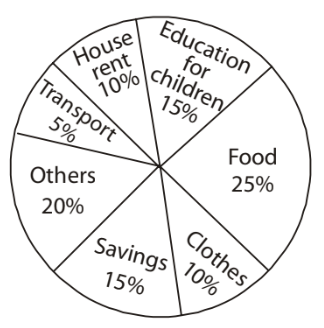
- The pie - chart gives the expenditure (in percentage) on various items and savings of a family during a month. Monthly savings of the family is 3, 000. On which item is the expenditure maximum and how much is it?
-
View Hint View Answer Discuss in Forum
Expenditure of food = 25%
Savings = 15%
∵ 15% ≡ $ 3000∴ 25% ≡ 3000 × 25 = $ 5000 15 Correct Option: D
Expenditure of food = 25%
Savings = 15%
∵ 15% ≡ $ 3000∴ 25% ≡ 3000 × 25 = $ 5000 15
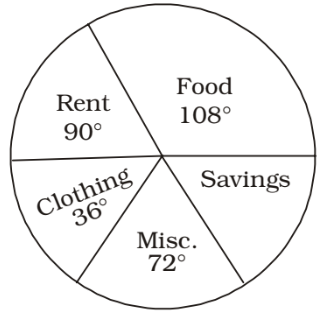
- The following pie - chart shows the monthly expenditure of a family on food, clothing, rent, miscellaneous expenses and savings. What is the central angle for savings?
-
View Hint View Answer Discuss in Forum
Food + Rent + Clothing + Miscellaneous
⇒ 108 ° + 90° + 36° + 72° = 306°
∴ Savings ⇒ 360° – 306° = 54°.Correct Option: A
Food + Rent + Clothing + Miscellaneous
⇒ 108 ° + 90° + 36° + 72° = 306°
∴ Savings ⇒ 360° – 306° = 54°.

