Introduction to Data Interpretation
Direction: The following Bar Diagram depicts figures for some agricultural imports from January-May, 2008. Answer (as closely as possible) the questions using the date provided here

- What was the total cost (in $) of wheat import in March?
-
View Hint View Answer Discuss in Forum
According to given bar graph , we have
Total Wheat import in March = 36 tonnes
Cost of Wheat = $ 156Correct Option: B
According to given bar graph , we have
Total Wheat import in March = 36 tonnes
Cost of Wheat = $ 156
Required cost of wheat = 36 × 156 = $ 5616
- What is the average cost of potato import in February and March?
-
View Hint View Answer Discuss in Forum
As per the given bar graph , we have
Potato import in February = 33 tonnes
Potato import in March = 33 tonnes
Cost of potato = $ 120Required average price = 1 (33 × 120 × + 33 × 120) 2
Correct Option: A
As per the given bar graph , we have
Potato import in February = 33 tonnes
Potato import in March = 33 tonnes
Cost of potato = $ 120Required average price = 1 (33 × 120 × + 33 × 120) 2 Required average price = 1 × 120 × 66 = $ 3960 2
Direction: Study the graph and answer the following questions.

- How many times of the production of company A is that of the company D?
-
View Hint View Answer Discuss in Forum
As per the given bar graph , we have
The production of company A = 1500
The production of company D = 2700Required answer = The production of company A The production of company D
Correct Option: C
As per the given bar graph , we have
The production of company A = 1500
The production of company D = 2700Required answer = The production of company A The production of company D Required answer = 2700 = 9 = 1.8 1500 5
- What is the ratio of companies having more demand than production to those having more production than demand?
-
View Hint View Answer Discuss in Forum
According to given bar graph , we have
Number of companies having more demand than production ( A , C and E companies ) = 3
Number of companies having more production than demand ( B and D companies ) = 2
Required ratio = Number of companies having more demand than production : Number of companies having more production than demandCorrect Option: D
According to given bar graph , we have
Number of companies having more demand than production ( A , C and E companies ) = 3
Number of companies having more production than demand ( B and D companies ) = 2
Required ratio = Number of companies having more demand than production : Number of companies having more production than demand
∴ Required ratio = 3 : 2
- The average production of the companies A, B, C and that of the companies D, E are in the ratio :
-
View Hint View Answer Discuss in Forum
From the given bar diagram , we see
Total production of the companies A, B and C = 1500 + 1800 + 1000
Number of companies A, B and C = 3
Total production of the companies D and E = 2700 + 2200
Number of companies D and E = 2
Required ratio = Average production of the companies A, B and C : Average production of the companies D and ECorrect Option: B
From the given bar diagram , we see
Total production of the companies A, B and C = 1500 + 1800 + 1000
Number of companies A, B and C = 3
Total production of the companies D and E = 2700 + 2200
Number of companies D and E = 2
Required ratio = Average production of the companies A, B and C : Average production of the companies D and E
Required ratio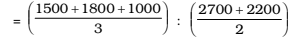
Required ratio = 2 × 4300 : 4900 × 3 = 86 : 147

