Introduction to Data Interpretation
Direction: Study the following graph carefully and answer the questions given below it.
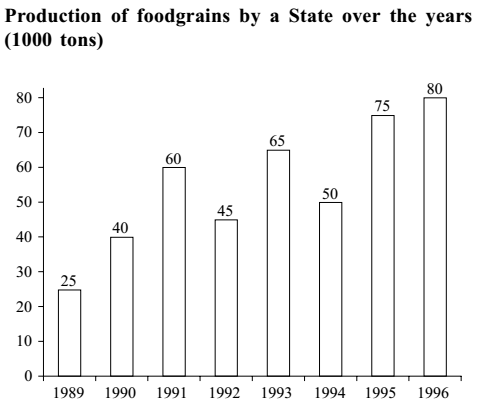
- In how many of the given years was the production of foodgrains more than average production of the given years?
-
View Hint View Answer Discuss in Forum
Average production
= 15 + 40 + 60 + 45 + 65 + 50 + 70 + 80 8 Correct Option: C
Average production
= 15 + 40 + 60 + 45 + 65 + 50 + 70 + 80 8 = 440 = 55 . 8
The average production of the year is 55 and as we are seeing in the graph that the year 1991, 1993, 1995, 1996 have more than the 55.
Direction: Study the following graph carefully and answer the questions given below it.
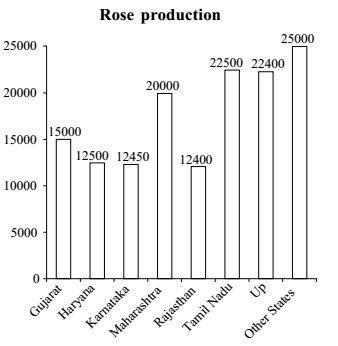
- What is the approximate average production of roses (in thousands) across all the states?
-
View Hint View Answer Discuss in Forum
Total production of rose by all the States = 142250
Total number of states = 8Correct Option: D
Total production of rose by all the States = 142250
Total number of states = 8
Average = Total production of rose by all the States / Total number of states
∴ Average = 142250 ≈ 18 thousand 8 x 1000
- Which of the following State(s) contribute(s) less than 10 % in the total rose production?
-
View Hint View Answer Discuss in Forum
Total rose production = ( 15000 + 12500 + 12450 + 20000 + 12400 + 22500 + 22400 + 25000 ) = 142250
Calculate the % rose production.
% Rose Production increase in State = Rose production in state x 100 / Rose production in All state
Percentage production of rose in the States (the lowest four states)Correct Option: C
Total rose production = ( 15000 + 12500 + 12450 + 20000 + 12400 + 22500 + 22400 + 25000 ) = 142250
% Rose Production increase in State = Rose production in state x 100 / Rose production in All state
% Rose Production increase in Gujrat = Rose production in Gujrat x 100 / Rose production in All state
% Rose Production increase in Gujrat = 15000 x 100 / 142250
% Rose Production increase in Gujrat = 1500 x 100 / 14225
% Rose Production increase in Gujrat = 300 x 100 / 285
% Rose Production increase in Gujrat = 60 x 100 / 57
% Rose Production increase in Gujrat = 6000 / 57 = 10.54 %
Similarly Calculate the % Rose Production increase in all states one by one and compare them.
Percentage production of rose in the States (the lowest four states)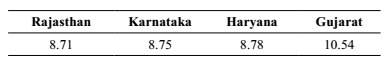
- If total percentage contribution of the States having production of roses below twenty thousand is considered, which of the following statements is true?
-
View Hint View Answer Discuss in Forum
It is 36.8% approximately.
Correct Option: E
It is 36.8% approximately.
- By what percentage rose production of other States is more than that of the Maharashtra?
-
View Hint View Answer Discuss in Forum
Required percentage
= 25 - 20 X 100 20
Correct Option: A
Required percentage
= 25 - 20 X 100 = 25 % (more) 20

