Introduction to Data Interpretation
Direction: Study the following graph carefully and answer the questions given below.
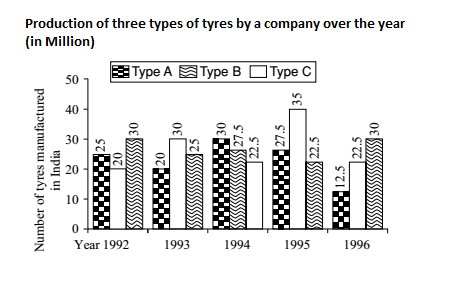
- In which of the following years was the maximum production of C type?
-
View Hint View Answer Discuss in Forum
As we can see in the graph the maximum chart for the C.
Correct Option: E
As we can see in the graph the maximum chart for the C is in 1995.
Direction: Bar chart showing the sales of books (in 1000) from six branches B1, B2, B3, B4, B5 and B6 of a publishing company in 2000 and 2001 is given below. Study the chart and answer the questions.
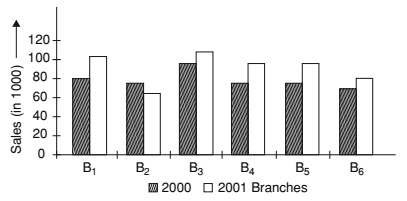
- Total sales of Branch B6 for both the years is what per cent of the total sales of Branch B3 for both the years?
-
View Hint View Answer Discuss in Forum
∴ Required Percentage = Total sales of Branch B6 in 2000 and 2001 years x 100 % Total sales of Branch B3 in 2000 and 2001 years
Correct Option: B
∴ Required Percentage = Total sales of Branch B6 in 2000 and 2001 years x 100 % Total sales of Branch B3 in 2000 and 2001 years
Total sales of Branch B6 in 2000 and 2001 years = 70 + 80 = 150
Total sales of Branch B3 in 2000 and 2001 years = 95 + 110 = 205Required Percentage = 150 x 100 = 73.17% 205
- What is the ratio of the total sales of Branch B2 for both the years to the total sales of Branch B4 for both the years?
-
View Hint View Answer Discuss in Forum
∴ Required ratio = the ratio of the total sales of Branch B2 in 2000 and 2001 years : the ratio of the total sales of Branch B4 in 2000 and 2001 years
Correct Option: D
∴ Required ratio = the ratio of the total sales of Branch B2 in 2000 and 2001 years : the ratio of the total sales of Branch B4 in 2000 and 2001 years
the ratio of the total sales of Branch B2 in 2000 and 2001 years = 75 + 65 = 140
the ratio of the total sales of Branch B4 in 2000 and 2001 years = 85 + 95 = 180
Required ratio = 140:180 = 7:9
- What percent of the average sales of branches B1, B2 and B3 in 2001 is the average sales of branches B1, B3 and B6in 2000?
-
View Hint View Answer Discuss in Forum
∴ Required percentage = Average sales of branches B1, B2 and B3 in 2001 x 100% Average sales of branches B1, B3 and B6in 2000 Correct Option: D
Average sales of branches B1, B2 and B3 in 2001
= 105 + 65 + 110 = 280 3 3
Average sales of branches B1, B3 and B6 in 2000= 80 + 95 + 70 = 245 3 3 ∴ Required percentage = Average sales of branches B1, B2 and B3 in 2001 x 100% Average sales of branches B1, B3 and B6in 2000 ∴ Required percentage = 280/3 x 100 = 114.28 245/3
- What is the average sale of books from all the branches for the year 2000?
-
View Hint View Answer Discuss in Forum
Required average = B1 + B2 + B3 + B4 + B5 + B6 6
Correct Option: B
Required average = B1 + B2 + B3 + B4 + B5 + B6 6
Required average= 80 + 75 + 95 + 85 + 75 + 70 = 480 = 80 6 6

