Introduction to Data Interpretation
Direction: The Pie Chart shows the expenditure of a country on various sports during a particular year.
Study the graph and answer the questions.

- Study the graph & answer the question
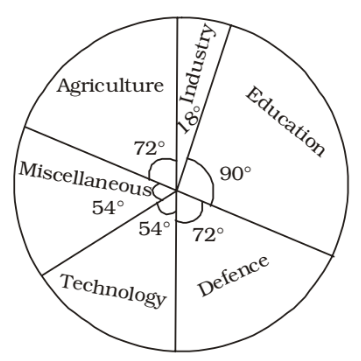
In a certain country, allocations to various sectors of the yearly budget per $ 1000 crores are represented by this pie-diagram. The expenditure (in $) on Agriculture is
-
View Hint View Answer Discuss in Forum
Expenditure on agriculture sector
= 72° × 1000 360
= $ 200 croresCorrect Option: D
Expenditure on agriculture sector
= 72° × 1000 360
= $ 200 crores
- How much per cent less is spent on football than that on cricket?
-
View Hint View Answer Discuss in Forum
Required percentage
= 81 - 54 × 100 81 = 27 × 100 = 33 1 % 81 3 Correct Option: C
Required percentage
= 81 - 54 × 100 81 = 27 × 100 = 33 1 % 81 3
- How much per cent more is spent on Hockey than that on Golf?
-
View Hint View Answer Discuss in Forum
Required percentage
= 63 - 36 × 100 = 75 % 36 Correct Option: D
Required percentage
= 63 - 36 × 100 = 75 % 36
- If the total amount spent on cricket and hockey together is $ 80,000, the total amount spent on sports is
-
View Hint View Answer Discuss in Forum
∵ (81 + 63)° ≡ 80000
∴ 360° ≡ $ 80000 × 360° 144°
= & 200000Correct Option: B
∵ (81 + 63)° ≡ 80000
∴ 360° ≡ $ 80000 × 360° 144°
= & 200000
Direction: In the following questions, study the two pie- charts and answer the questions.

- The average amount spent on Education, Grocery and Savings from April month’s salary is:
-
View Hint View Answer Discuss in Forum
Required Average
= 1 × 24000 × (47 + 4 + 18)% 3 = 1 × 24000 × 69 = $ 5520 3 100 Correct Option: D
Required Average
= 1 × 24000 × (47 + 4 + 18)% 3 = 1 × 24000 × 69 = $ 5520 3 100

