Introduction to Data Interpretation
Direction: The annual agricultural production (in tonnes) of an Indian state is given in the pie chart. The total production is 9000 tonnes. Read the pie chart and answer the question.
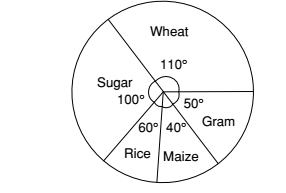
- What is the annual production of wheat?
-
View Hint View Answer Discuss in Forum
Given :- 360° = 9000 tonnes
then ,1° = 9000 tonnes 360 Correct Option: A
Given :- 360° = 9000 tonnes
then ,1° = 9000 tonnes 360 ∴ the annual production of wheat = 110° ≡ 9000 x 110 = 2750 tonnes 360
Direction: Study the following table carefully and answer the questions given below it.
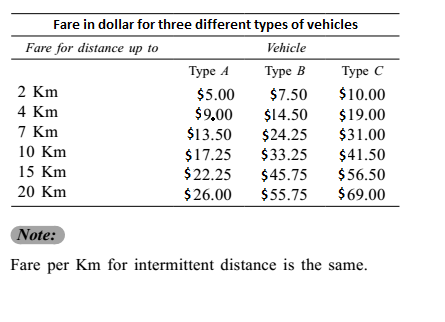
- Shiv Kumar has to travel a distance of 15 Km in all. He decides to travel equal distance by each of the three types of vehicles. How much money is to be spent as fare?
-
View Hint View Answer Discuss in Forum
∴ Total fare = Fare of A + Fare of B + Fare of C
Correct Option: D
Distance to be travelled by each type of vehicle
= 15 = 5 km 3
Since, to travel 5 Km by vehicle A, he will pay $ 9 for 4 Km and for the next 1 Km he will have to pay$ (13.5 - 9.00 ) x 1 ( 7 - 4 )
Similarly, for other cases.Fare by A = $ 9 + (13.50 - 9 ) = 9 + 1.50 = $ 10.50 ( 7 - 4 ) Fare by B = 14.50 + ( 24.25 - 14.50 ) = 14.50 + 3.25 = $ 17.75 ( 7 - 4 ) Fare by C = 19 + ( 31 - 19 ) = 19 + 4 = $ 23 ( 7 - 4 )
∴ Total fare = Fare of A + Fare of B + Fare of C
Total fare = 10.50 + 17.75 + 23 = $ 51.25.
- Rita hired a Type B vehicle for travelling a distance of 18 Km. After travelling 5 Km, she changed the vehicle to type A. Again, after travelling 9 Km by Type A vehicle, she changed the vehicle to Type C and completed her journey. How much money did she spend did in all?
-
View Hint View Answer Discuss in Forum
∴ Total fare = Fare by A for 8 Km + Fare by B for 5 km + Fare by C for 5 Km
Correct Option: E
Fare by B for 5 km = 14.50 + 3.25 = $ 17.75
Fare by A for 8 Km = 13.50 + 17.25 - 13.50 = $ 14.75 3 Fare by C for 5 Km = 19 + 31 - 19 = $ 23 3
∴ Total fare = Fare by A for 8 Km + Fare by B for 5 km + Fare by C for 5 Km
Total fare = 17.75 + 14.75 + 23 = 55.50.
- Ajit Singh wants to travel a distance of 15 Km. He starts his journey by Type A vehicle. After travelling 6 Km, he changes the vehicle to Type B for the remaining distance. How much money will he be spending in all?
-
View Hint View Answer Discuss in Forum
∴ Total fare = Fare by A + Fare by B
Correct Option: A
Fare by A = $ 9 + 4.50 = $ 12 3 x 2 Fare by B = $ 24.25 + 33.25 - 24 = $ 30.25 3 x 2
∴ Total fare = Fare by A + Fare by B
∴ Total fare = 30.25 + 12 = $ 42.25.
- Fare for 14th Km by Type C vehicle is equal to the fare for which of the following?
-
View Hint View Answer Discuss in Forum
Fare for 14th Km by C = 56.50 - 41.50 = $ 3 15 - 10 Correct Option: B
Fare for 14th Km by C = 56.50 - 41.50 = $ 3 15 - 10 Fare for 9th Km by B = 33.25 - 24.25 = $ 3 10 - 7

