Introduction to Data Interpretation
Direction: Read the following pie-chart to answer the questions given below it.

- The ratio of the total amount of money spent on housing to that spent on education was :
-
View Hint View Answer Discuss in Forum
Expenditure on housing Expenditure on Education = 15 % = 15 = 5 = 5 : 4 12 % 12 4 Correct Option: D
Expenditure on housing Expenditure on Education = 15 % = 15 = 5 = 5 : 4 12 % 12 4
- If the total amount spent was $ 46000/-, how much was spent on clothing and housing together?
-
View Hint View Answer Discuss in Forum
Total amount spent = 46,000
Amount spent clothing and housing together = (10% + 15%) of
$ 46000= 25 × 46,000 = $ 11500 100 Correct Option: A
Total amount spent = 46,000
Amount spent clothing and housing together = (10% + 15%) of
$ 46000= 25 × 46,000 = $ 11500 100
- If the total amount spent during the year 1998 was $ 46000/-, the amount spent on food, was :
-
View Hint View Answer Discuss in Forum
Total amount spent = $ 46,000
Amount spent on food = 23% of 46,000= 23 × 46,000 = $ 10580 100 Correct Option: B
Total amount spent = $ 46,000
Amount spent on food = 23% of 46,000= 23 × 46,000 = $ 10580 100
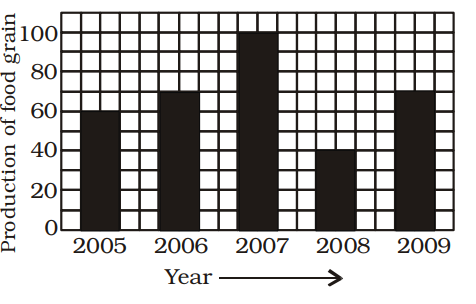
- Study the above bar graph showing the production of food grains (in million tons). What is the ratio between the maximum production and the minimum production during the given period?
-
View Hint View Answer Discuss in Forum
According to given bar graph , we see
The maximum production of food grains in 2007 = 100 million tonnes
The minimum production of food grains in 2008 = 40 million tonnes
∴ Required ratio = The maximum production of food grains in 2007 : The minimum production of food grains in 2008Correct Option: D
According to given bar graph , we see
The maximum production of food grains in 2007 = 100 million tonnes
The minimum production of food grains in 2008 = 40 million tonnes
∴ Required ratio = The maximum production of food grains in 2007 : The minimum production of food grains in 2008
Required ratio = 100 : 40 = 5 : 2
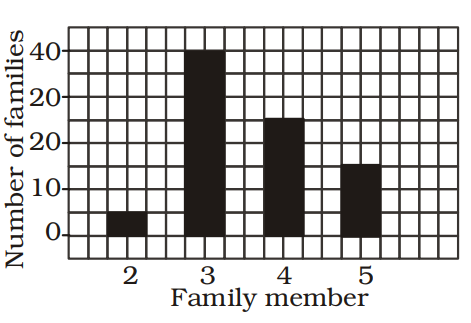
- Study the bar graph carefully and answer the following question. Which type of family is the most common?
-
View Hint View Answer Discuss in Forum
As per the given above bar graph , we see that
3 members type of family is the most common , which have number of families 40.Correct Option: B
As per the given above bar graph , we see that
3 members type of family is the most common , which have number of families 40.
Hence , required answer is option B .

