Introduction to Data Interpretation
Direction: The graph given below shows the daily income of 50 workers in a factory. Study the graph and answer the questions.

- The median wages in the factory is
-
View Hint View Answer Discuss in Forum
According to given graph in question ,
Lowest value in wages = 120
Highest value in wages = 200Median = Lowest value + Highest value 2
Correct Option: D
According to given graph in question ,
Lowest value in wages = 120
Highest value in wages = 200Median = Lowest value + Highest value 2 Median = 120 + 200 = $ 160 2
- What percentage of the factory workers earn between $ 150 and $ 180?
-
View Hint View Answer Discuss in Forum
As per the given graph in question ,
Wages Number of workers 120 12 140 26 - 12 = 14 160 34 – 26 = 8 180 40 – 34 = 6 200 50 – 40 = 10
From above given table , Number of workers earn between $ 150 and $ 180 = 8
Total number of workers = 12 + 14 + 8 + 6 + 10 = 50
Correct Option: B
As per the given graph in question ,
Wages Number of workers 120 12 140 26 - 12 = 14 160 34 – 26 = 8 180 40 – 34 = 6 200 50 – 40 = 10
From above given table , Number of workers earn between $ 150 and $ 180 = 8
Total number of workers = 12 + 14 + 8 + 6 + 10 = 50∴ Required percent = 8 × 100 = 16% 50
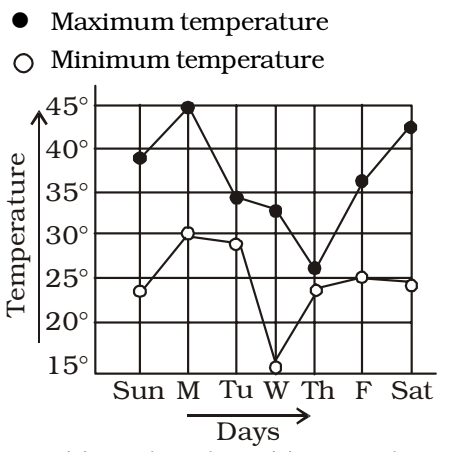
- The following graph represents the maximum and minimum temperature recorded every day in a certain week. The day on which the difference between the maximum and minimum temperature was maximum is
-
View Hint View Answer Discuss in Forum
As per the given graph in question ,
Difference between temperatures :
Sunday ⇒ 39 – 23 = 16°
Saturday ⇒ 42.5 – 24 = 18.5°
Wednesday ⇒ 32.5 – 15 = 17.5°Correct Option: B
As per the given graph in question ,
Difference between temperatures :
Sunday ⇒ 39 – 23 = 16°
Saturday ⇒ 42.5 – 24 = 18.5°
Wednesday ⇒ 32.5 – 15 = 17.5°
Hence , required answer is Saturday .
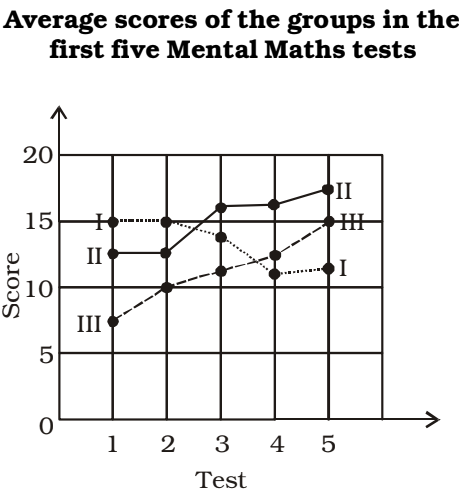
- A class is divided into 3 equal groups and the class is given 5 tests in Maths. Average score of the groups and the tests is given below. The average score of the entire class in Test II is
-
View Hint View Answer Discuss in Forum
According to given graph in question ,
Sum of marks = 10 + 12.5 + 15
Total number of groups = 3Average marks = 10 + 12.5 + 15 3
Correct Option: D
According to given graph in question ,
Sum of marks = 10 + 12.5 + 15
Total number of groups = 3Average marks = 10 + 12.5 + 15 3 Average marks = 37.5 = 12.5 3
Direction: A graph showing the price of rice in India during the year 2000 to 2003 is given below. Study the graph carefully and answer the questions.

- The maximum difference in price between any two years was in the month of
-
View Hint View Answer Discuss in Forum
From the given table in question ,
Difference = 23 – 5 = $ 18 i.e. month is December.Correct Option: D
From the given table in question ,
Difference = 23 – 5 = $ 18
So , the maximum difference in price between any two years was in the month of December.

