-
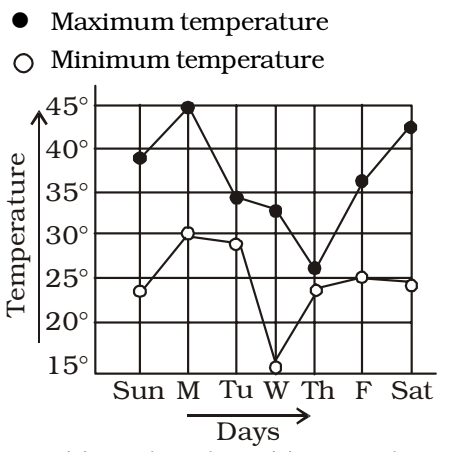
The following graph represents the maximum and minimum temperature recorded every day in a certain week. The day on which the difference between the maximum and minimum temperature was maximum is
-
- Wednesday
- Saturday
- Sunday
- Monday
Correct Option: B
As per the given graph in question ,
Difference between temperatures :
Sunday ⇒ 39 – 23 = 16°
Saturday ⇒ 42.5 – 24 = 18.5°
Wednesday ⇒ 32.5 – 15 = 17.5°
Hence , required answer is Saturday .

