Bar graph
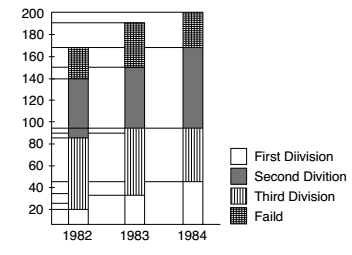
Direction: The following bar graph depicts the result for BSc students of a college for 3 years. Read the graph and answer the questions based on this graph.
- The percentage of students passed in 1982 was
-
View Hint View Answer Discuss in Forum
The percentage of students passed in 1982 = Total passed students in 1982 x 100 Total number of students in 1982 Correct Option: D
As per given Bar graph we can see that,
Total passed students in 1982 = 140
Total number of students in 1982 = 170The percentage of students passed in 1982 = Total passed students in 1982 x 100 Total number of students in 1982 Required percentage = 140 x 100 170 = 1400 = 82 6 % 17 17
- The aggregate pass percentage during the 3 years was
-
View Hint View Answer Discuss in Forum
As per given Bar graph we can see that,
Total passed students = 140 + 150 + 165 = 455
Total students = 170 + 195 + 200 = 565
∴ Required percentage = Total passed students x 100 Total students Correct Option: C
As per given Bar graph we can see that,
Total passed students = 140 + 150 + 165 = 455
Total students = 170 + 195 + 200 = 565∴ Required percentage = Total passed students x 100 Total students = 455 x 100 565 = 9110 = 80 60 % 113 113
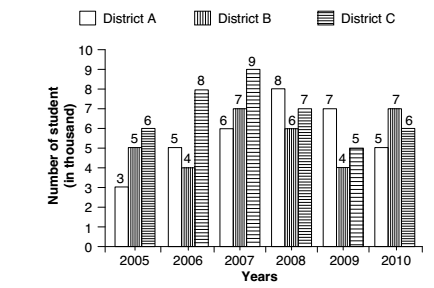
Direction: Study the following graph carefully to answer the questions that follow : Number of students (in thousand) enrolled in 3 different districts in 6 different years.
- What was the percentage increase in enrollment in the number of students in District C in year 2007 as compared to that in the previous year?
-
View Hint View Answer Discuss in Forum
∵ Required Percentage = Total change in enrollment x 100 Total number of students in District C in year 2006 Correct Option: D
As per given graph, We have
Number of students in District C in year 2007 = 9
Number of students in District C in year 2006 = 8
Total change in enrollment = Students in District C in year 2007 - Students in District Cin year 2006
Total change in enrollment = 9 - 8 = 1∵ Required Percentage = Total change in enrollment x 100 Total number of students in District C in year 2006 = 1 x 100 = 12.5 % 8
- What was the difference between the number of students enrolled in all the 3 districts together in the year 2008 and the number of students enrolled in District B over all the years together?
-
View Hint View Answer Discuss in Forum
Required Difference = Students in district B over all the years ( 2005 to 2010 ) − Students in 2008 in all 3 districts
Correct Option: A
Students enrolled in 2008 in all three districts ( A + B + C ) = 8000 + 6000 + 7000 = 21000
Students enrolled in district B over all the years ( 2005 to 2010 ) = 5000 + 4000 + 7000 + 6000 + 4000 + 7000 = 33000
∴ Required Difference = Students in district B over all the years ( 2005 to 2010 ) − Students in 2008 in all 3 districts
∴ Required Difference = 33000 − 21000 = 12000
- In which year was the number of students enrolled in all the three districts together the second highest?
-
View Hint View Answer Discuss in Forum
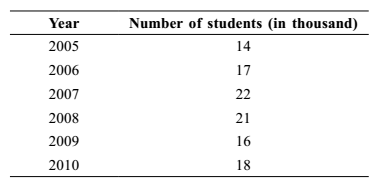
Total number of students as per given, we can draw as below.
Correct Option: C
From given graph , we can see that
Since , In 2008 year is the number of students enrolled in all the given 3 districts together the second highest.
Hence required Answer will be 2008 year .

