Bar graph
Direction: The bar graph given below shows annual result of different classes of a school. Study the graph carefully and attempt the question that follow:
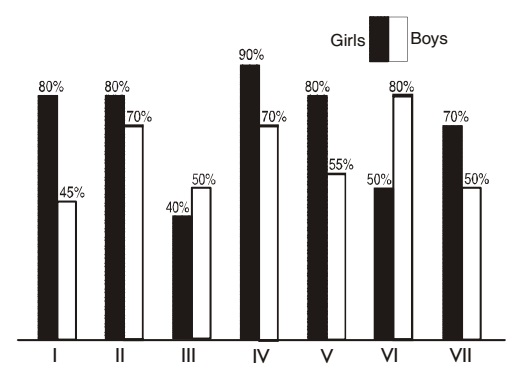
- In which class pass percentage of boys is more than the average pass percentage of girls of the school?
-
View Hint View Answer Discuss in Forum
Average pass percentage of girls = Total number of pass girls in school/7
Correct Option: A
Average pass percentage of girls = Total number of girls for pass the class/7
Average pass percentage of girls = 80 + 80 + 40 + 90 + 80 + 50 + 70/7 = 490/7 = 70%
Therefore. in class VI pass percentage of boys is more than the average pass percentage of girls.
Direction: The following bar chart shows the amount accrued from additional taxation by the government during certain successive years. Study the chart carefully and answer the questions that follow:
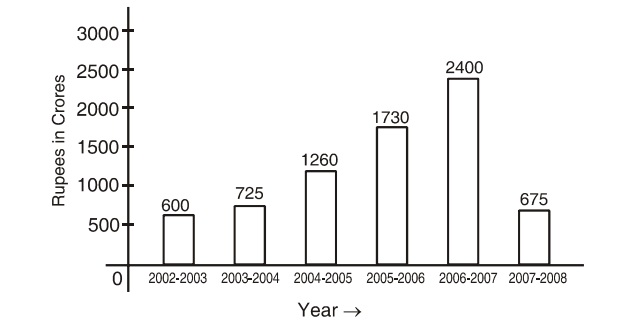
- What is the average amount of taxation during all these years?
-
View Hint View Answer Discuss in Forum
Average of the total taxation during the years = total taxation for all the years / 6.
Correct Option: C
Average of the total taxation during the years = total taxation for all the years / 6.
Average of the total taxation during the years = 600 + 725 + 1260 + 1730 + 2400 + 625 = 7390/6 = 1231.7 crores
- Between the years 2005-06 and 2006-07 the taxation was increased by:
-
View Hint View Answer Discuss in Forum
Increase in taxation in between the financial years 2005-06 and 2006-07.
Correct Option: A
Increase in taxation in between the financial years 2005-06 and 2006-07
= Rs. (2400 - 1730) = RS. 670 crores
- Percentage decrease in taxation in between the years 2006-7 and 2007-08 was:
-
View Hint View Answer Discuss in Forum
Percentage of total decrease in taxation between the years 2006-07 and 2007-08.
Correct Option: A
Percentage of total decrease in taxation between the years 2006-07 and 2007-08
= (2400 - 675/ 2400 x 100 = 1725 x 100/ 2400 = 71.8%
- Total increase in taxation was how much percent between the years 2004-05 and 2005-06?
-
View Hint View Answer Discuss in Forum
Percentage of total increase = (1730 - 1260)/ 1260 x 100
Correct Option: A
Percentage of total increase = (1730 - 1260)/ 1260 x 100 = 470 x 100/ 1260 = 37.3%

