Bar graph
Direction: The bar graph provided below represents the production of rice and wheat in different states of a country in a certain year. Answer the question given below based on the bar graph.
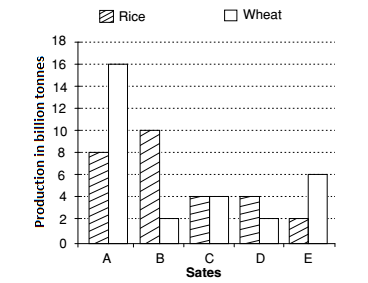
- The average of production of rice in the mentioned states (in million tonnes) is:
-
View Hint View Answer Discuss in Forum
Average production of rice = 
Sum of the total production of rice in states 
total numbers of states Correct Option: B
As per given bar graph , we can see that
The production of rice in states
A = 8 million tonnes
B = 10 million tonnes
C = 4 million tonnes
D = 4 million tonnes
E = 2 million tonnesAverage production of rice = Sum of the total production of rice in states total numbers of states = 8 + 10 + 4 + 4 + 2 = 28 million tonnes 5 5
= 5.6 million tonnes
Direction: The bar graph given below shows annual result of different classes of a school. Study the graph carefully and attempt the question that follow:
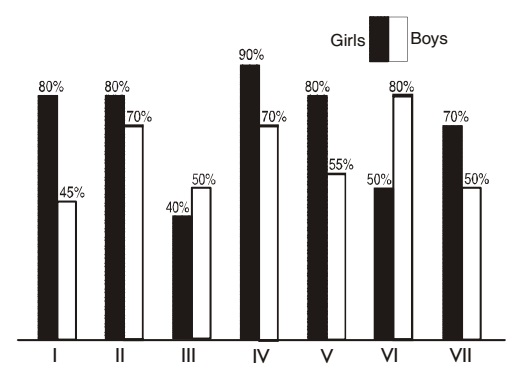
- In which of the following classes pass percentage of girls is less than the average pass percentage of the school?
-
View Hint View Answer Discuss in Forum
Average pass percentage of the school = Total number of pass Boys and girls / 14
Correct Option: A
Average pass percentage of the school = Total number of pass Boys and girls / 14
Average pass percentage of the school = (80 + 45 + 80 + 70 + 40 + 50 + 90 + 70 + 80 + 55 + 50 + 80 + 70 + 50/14 = 910)/14 = 65%
Therefore, it is clear that pass percentage of the girls in III and VI classes is less than the average pass percentage of the school.
- Average pass percentage of boy in classes II and III is equal to average pass percentage of girls in which of the following classes?
-
View Hint View Answer Discuss in Forum
As per graph
Average pass percentage of the boys in classes II and III = 70 + 50/2 = 120/2 = 60%
Try option one by one and solve the question.Correct Option: C
As per graph
Average pass percentage of the boys in classes II and III = 70 + 50/2 = 120/2 = 60%
As per given graph we can find that
Average pass percentage of the boys in classes VI and Vii = 50 + 70/2 = 60%
Therefore. average pass percentage of boys in classes II and III is equal to the average pass percentage of girls in classes VI and VII.
- Result of which class shows maximum difference between pass percentage of the girls and the boy?
-
View Hint View Answer Discuss in Forum
Calculate the difference between pass percentage of girls and boys in classes.
Correct Option: A
Difference between pass percentage of girls and boys in class I = 80 - 45 = 35%
Difference between pass percentage of girls and boys in class II = 80 - 70 = 10%
Difference between pass percentage of girls and boys in class III = 50 - 40 = 10%
Difference between pass percentage of girls and boys in class IV = 90 - 70 = 20%
Difference between pass percentage of girls and boys in class V = 80 - 55 = 25%
Difference between pass percentage of girls and boys in class VI = 80 - 50 = 30%
Difference between pass percentage of girls and boys in class VII = 70 - 50 = 20%
Hence, it is clear that result of class I shows maximum difference between pass percentage of the girls and the boys.
- In which class number of failed girls is minimum?
-
View Hint View Answer Discuss in Forum
In class IV pass percentage of girls is the highest.
Correct Option: C
In class IV pass percentage of girls is the highest. Thereore in this class only number of failed girls is the minimum.

