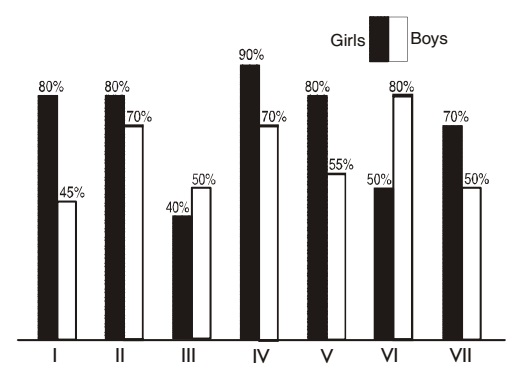
Direction: The bar graph given below shows annual result of different classes of a school. Study the graph carefully and attempt the question that follow:
-
In which of the following classes pass percentage of girls is less than the average pass percentage of the school?
-
- III - VI
- V - VI
- VI - VII
- III - IV
Correct Option: A
Average pass percentage of the school = Total number of pass Boys and girls / 14
Average pass percentage of the school = (80 + 45 + 80 + 70 + 40 + 50 + 90 + 70 + 80 + 55 + 50 + 80 + 70 + 50/14 = 910)/14 = 65%
Therefore, it is clear that pass percentage of the girls in III and VI classes is less than the average pass percentage of the school.

