Bar graph
Bar graph is the easiest and most commonly used method of representing different types of data. A bar is a thick line whose width is shown merely for attention. A bar graph consists of bars.In this , the rectangular bar or the length of column represents the numerical value . In generally bar graph , two axes are given , in which one is vertical axis (Y - axis) and second is horizontal axis (X - axis).
Therefore, quantities can be compared by the height of bars in the graph. Bars may be horizontal or vertical.
The height of the bar is a measure of the quantity that it represents. They may be placed adjacent to each other or may be separated from each other by spaces depending upon the problem and on the other hand the numerical value related to the non-variant variable is displayed on the X-axis. We can easily solve to given question based on bar graph .
Direction: The following bar graph shows the production of food grains in India during certain year. Study the graph carefully and answer the questions given below:
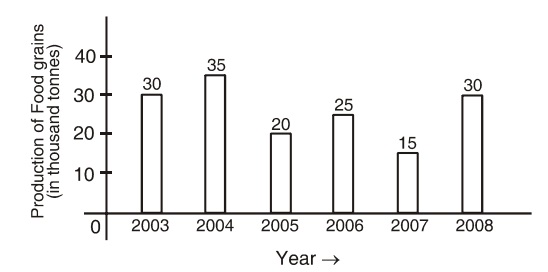
(i) The difference between the foodgrain productions of 2004 and 2008 is:
Sol : - From above the given bar graph , we can see that
Difference between the production of foodgrains during 2004 and 2008 = 35 - 30 = 5 thousand tonnes.
(ii) Percentage increase in the production of foodgrains in the year 2008 over the year 2007 is:
Sol : - From above the given bar graph , we can see that
Percentage increase in food grain production
| = | 30 - 15 | × 100 = 100% |
| 15 |
(iii) Total food grain production in 2005 and 2007 is equal to the production during which of the following years?
Sol : - As per the above given bar graph ,
Total production in 2005 and 2007 = 20 + 15 = 35 thousand tonnes. This total production is equal to the production in the year 2004.
(iv) Rate of change in quantity of production in which of the following two consecutive years is at the minimum level?
Sol :- On the basis of above given bar graph ,
Rate of change in the amount of
| = (Production in 2004 - Production in 2003) × | |
| Production in 2003 |
Rate of change in the amount of production in the year
| 2004 over the year 2003 = (35 - 30) × | |
| 30 |
| = 5 × | |
= 16.67% |
| 30 |
Similarly ,
Rate of change in the amount of production in the year 2006 over the year
| 2005 = (25 - 20) × | |
| 20 |
| = 5 × | |
= 25% |
| 20 |
Rate of change in the amount of production in the year 2007 over the year
| 2008 = (30 - 15) × | |
| 15 |
| = 15 × | |
= 100% |
| 15 |
Rate of change in the amount of production in the year 2006 over the year
| 2007 = (25 - 15) × | |
| 15 |
| = 10 × | |
= 66.67% |
| 15 |
Hence, it is clear that the rate of change in the amount of production during the consecutive years 2007 and 2008 is at the highest level.
Direction: The following bar chart shows the amount accrued from additional taxation by the government during certain successive years. Study the chart carefully and answer the questions that follow:

(i) In between which of the following two successive financial years increase in taxation was at the highest level?
Sol : - From above the given bar graph , we can see that
Between the financial years 2005-06 and 2006-07, maximum increase of Rs. 670 crores had been registered in taxation.
(ii) Total increase in taxation was how much percent between the years 2004-05 and 2005-06?
Sol : - On the basis of above given bar graph ,
| Percentage of total increase = 1730 - 1260 | = 37.3% |
| 1260 |
(iii) Percentage decrease in taxation in between the years 2006 -07 and 2007-08 was:
Sol : - As per the above given bar graph ,
Percentage of total decrease in taxation between the years 2006-07 and 2007-08
| = | = | 71.8% |
| 2 | 2400 |
(iv) Between the years 2005-06 and 2006-07 the taxation was increased by:
Sol : - From above the given bar graph , we have
Increase in taxation in between the financial years 2005-06 and 2006-07
= Rs. (2400 - 1730) = Rs. 670 crores
(v) What is the average amount of taxation during all these years?
Sol : - From above the given bar graph , we have
Average of the total taxation during the years = total taxation for all the years / 6.
Average of the total taxation during the years = 600 + 725 + 1260 + 1730 + 2400 + 625 = 7390/6 = 1231.7 crores
Example 3 . Direction: Study the following graph carefully to answer the questions that follow : Distance (in Km) traveled by 5 different trucks in a day.
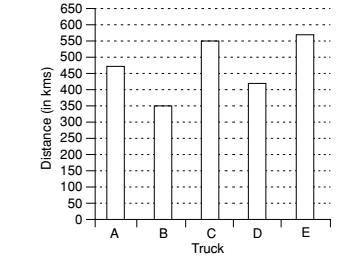
(i) What is the average distance traveled by all the trucks together?
Sol :- Given in the bar graph ,
Distance traveled by Trucks A = 475 , B = 350, C = 550, D = 425, E = 575,
Total distance covered by all the trucks = 475 + 350 + 550 + 425 + 575 = 2375 Km
Total number of the trucks = 5
| Required Average distance covered by all the trucks = | |
| Total number of the trucks |
Required Average distance covered by all the trucks = 2375 / 5 = 475 Km
(ii) The distance travelled by Truck E is approximately what percent of the total distance travelled by Track B and C together?
Sol :- As per given graph , we can see that
Total distance covered by E = 575 Km , Total distance covered by B and C together = 350 + 550 = 900 Km
| Required percentage = | × 100% | |
| Total distance covered by B and C together |
| = | x 100 ≈ 64% ≈ 62 % |
| 900 |
(iii) What is the ratio of the distance traveled by Truck A to the distance traveled by Truck D?
Sol :- As per the above given graph , we have
The distance traveled by Truck A = 475
The distance traveled by Truck Truck D = 425
Required ratio = The distance traveled by Truck A : The distance traveled by Truck D
Required ratio = 475 : 425 = 19 : 17
(iv) If the time taken by Truck C to cover the given distance was 8 hours, what was the average speed of the truck?
Sol :- Given :- Total distance traveled by truck C = 550
Time taken by truck C = 8 hours
Required average speed = Total distance traveled by truck C / Total time taken by truck C
Required average speed = 550 / 8 = 68.75 Km/h
(v) If Truck A covered the given distance at the average speed of 47.5 Km/h, what was the time taken by it to cover this distance?
Sol :- As per given graphs and question,
Total distance covered by A = 475 Km
Average Speed = 47.5 Km/h
Required Time taken = Total distance covered by A / Average speed
Required Time taken = 475 / 47.5 = 10 hours