Line chart
A line graph depicts the variation of a quantity with respect to the two parameters calibrated on the X and Y axes, respectively.
When we represent the mathematical data related to different types of facts with the help of a linear graph, then this type of graph is called a line graph. In this, we represent numerical values with a point line which indicates the position of quantities on the X - axis and Y - axis. The horizontal and vertical axis shows the change in the inclination of the line formed with two points.
In most of the cases, the quantity is measured as a function of time, for example- the variation in the quantity as time changes.
Important facts based on the line graph :-
(a) In order to solve the questions based on the given line graph, Firstly we study them carefully and mark the all information we get from them.
(b) Now, keeping in mind the known information in the given line graph , we try to solve the questions asked in it and definite its boundaries related to the graph.
(c) X - axis represents the time parameter (may be year or month) and Y - axis represents any other variable parameter which has different values with respect to time.
(d) The line going up indicates increase in the quantity with time.
(e) the line going down indicates decrease in the quantity with time.
(f) a horizontal line indicates no change in the quantity over that period.
(g) The gradient of the line graph helps us to compare the value of the change between two consecutive points.
Example 1. Direction: Study the information given in each of these questions and then answer the questions.
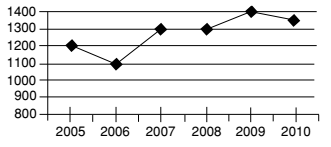
(i) What is the percent rise in production in 2007 from 2006? (Round off to two digits after decimal.)
Sol :- From the above given line graph , we have
Total change in production in 2007 from 2006 = 1300 - 1100 = 200
Production in 2006 = 1100
| ∴ Percentage increase = | × 100% |
| Production in 2006 |
| Required Percentage increase = | × 100 = 18.8% |
| 1100 |
Example 2. Direction: Study the following graph carefully and answer the questions given below.
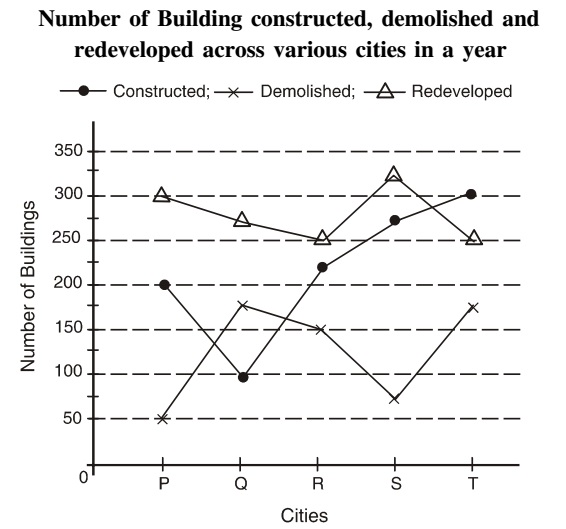
(i) What is the approximate average number of constructions (constructed, demolished and redeveloped) in the city R?
Sol :- As per the above given line graph ,
Average number of constructions in City R = (number of constructed building + number of demolished building + number of redeveloped building )/3
Average number of constructions in City R = 150 + 225 + 250/3 = 625/3 = 208.33 ≈ 208 %
(ii) What is the respective ratio of the number of buildings demolished in city T to the number of buildings redeveloped in city P?
Sol :- On the basis of above given line graph ,
| Required ratio = |
| number of buildings redeveloped in city P |
Required ratio = 175 : 300 = 7 : 12
(iii) What is the difference between the total constructions (constructed, demolished and redeveloped) in city Q and city T?
Sol :- As per the above given line graph,
| Total constructions in City Q = constructed building + demolished building + redeveloped building |
Total constructions in City Q = 100 + 175 + 275 = 550
Total constructions in City T = constructed building + demolished building + redeveloped building
Total constructions in City T = 175 + 250 + 300 = 725
Their difference = 725 - 550 = 175
(iv) The total number of buildings constructed across the cities is approximately what per cent of the total number of buildings redeveloped across the cities?
Sol :- From the above given line graph ,
Total number of buildings constructed across the cities = 200 + 100 + 225 + 300 = 1100
Total number of buildings redeveloped across the cities = 300 + 275 + 250 = 1400
| Required percentage = | = 78.57% ≈ 79% |
| 1400 |
(v) What is the average number of buildings demolished across the cities?
Sol :- As per the above given line graph ,
| Average number of building = |
| 5 |
| Average number of building = | = | = 125 |
| 5 | 5 |
Example 3. Direction: Study the following graph to answer the given questions.
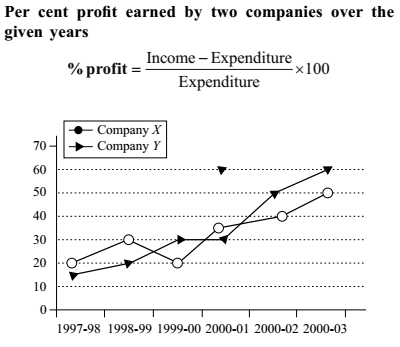
(i) In 1997–98, the expenditure of Company X was $ 40 billion. What was its income in that year?
Sol :- As per the above given line graph ,
As per given formula in question,
| % Profit = | × 100 | |
| Expenditure |
| Income = | × Expenditure | |
| 100 |
Given :- Expenditure of Company X = $ 40 million
Profit = 20 %
Put these values in above formula, we will get,
| Income = | × $ 40 million |
| 100 |
| Income = | × $ 40 million |
| 100 |
Income = 12 x 4 million $ = 48 million $
(ii) In 2002–03 the income of Company Y was $ 128 billion. What was its expenditure in that year?
Sol :- On the basis of above given line graph ,
In 2002–03 profit earned by company Y was 60%.
| Required expenditure = | × 100 | |
| 100 + profit |
| Required expenditure = | × 100 = $ 80 billion |
| 160 |
(iii) What was the difference in the expenditures of the two companies in 1999–2000?
Sol :- As per the above given line graph ,
The given graph depicts only the percent profit earned by the two companies over the given years. So we need Income information also to calculate the expenditure of the companies for this years. Hence the given information is insufficient to answer the question.
Hence, answer cannot be determined .
(iv) For Company Y, in which year is the percent of increase in percent profit over that of previous year the highest?
Sol :- From the above given line graph ,
Percent of increase in percent profit over that of the previous year for the given years is as follows :
| Year 1998 - 99 = | × 100 = 33.33% |
| 15 |
| Year 1999 - 00 = | × 100 = 50% |
| 20 |
Year 2000 - 01 : = 0 %
| Year 2001 - 02 = | × 100 = 66 | % |
| 30 | 3 |
| Year 2002 - 03 : | × 100 = 20% |
| 50 |
You do not need to do any rough work. See the graph and search for steep rise in the line joining the two ∆’s.
(v) If the income of Company X in 1998–99 was equal to the expenditure of Company Y in 2001–2002, what was the ratio of their respective profits?
Sol :- As per the above given line graph ,
Suppose in the year 1998–99 expenditure of company X = $ a
Then profit earned by company X in this year = $ (30% of a)
| Hence, income of company X = $ (130% of a) = $ | × a |
| 100 |
| Again, expenditure of company Y in 2001–02 = $ |
| 100 |
| Hence, profit earned by company Y in 2001–02 = $ | × |
| 100 | 100 |
Thus, required ratio = profit earned by company X in this year : profit earned by company Y in 2001–02
| Required ratio = | = | = | = | = 6 : 13 |
| 100 | 1000 | 100 × 130 × 50 | 65 |