Table chart
Data : -
When we collect information related to different types of facts, then these collected information is called data . The value of the information of these facts is numerically and it is only denoted in the numbers form.
Tabulation: -
When we organize the data related to any fact in the columns and rows in sequential order, then the table formed by them is called tabulation. It is the systematic and scientific presentation of numerical data. It helps the person to make comparisons and draw quick conclusions. we read the related data carefully and to give an accurate answer. In this, questions related to various types of problems such as average, percentage, ratio etc are asked.It is very important to have basic knowledge about these chapters, with the help of which we can easily answer the questions asked in tabulation.Tabular presentation makes complicated information easier to understand. In a table, data is arranged systematically in columns and rows.
Let us consider we can understand it with the help of the following given examples.
Example 1. Direction : Study the following table to answer the given questions.
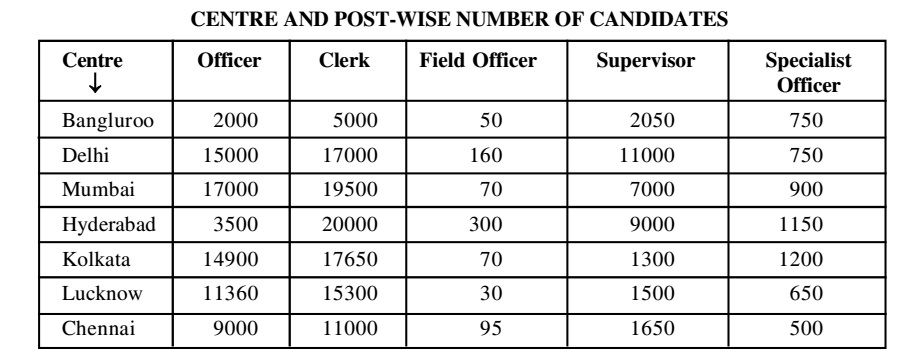
(i) Which centre has the higher number of candidates?
Sol :- As per the above given table ,
Number of candidates :
Delhi → 15000 + 17000 + 160 + 11000 + 750 = 43910
Hyderabad → 3500 + 20000 + 300 + 9000 + 1150 = 33950
Katakana → 14900 + 17650 + 70 + 1300 + 1200 = 35120
Mumbai → 17000 + 19500 + 70 + 7000 + 900 = 44470
Hence, Mumbai has the highest number of candidates.
(ii) What is the difference between total number of officers and clerks?
Sol :- From the above given table ,
Total number of officers = 2000 + 15000 + 17000 + 3500 + 14900 + 11360 + 9000 = 72760
Total number of clerk = 5000 + 17000 + 19500 + 20000 + 17650 + 15300 + 11000 = 105450
Their difference = 105450 - 72760 = 32690
(iii) In Chennai, the number of clerks is approximately how much percent more than that of officers ?
Sol :- On the basis of above given table ,
| Required percentage = | x 1000 = | ≈ 22% | ||
| 9000 | 90 |
(iv) Which centre has 3005 more number of clerks as compared to Bangluroo?
Sol :- From the above given table ,
Number of clerks in Bangluroo = 5000
Number of clerks in Hyderabad = 20000
More number of clerks in Hyderabad as compared to Bangluroo
| = 20000 - | x 1000 = 300% | |
| 5000 |
(v) In Katakana, number of specialist officers approximately what per cent of that of officers?
Sol :- From the above given table ,
| Required percentage = 1200 x | x 1000 ≈ 8% | |
| 14900 |
Example 2. Direction: Study the table carefully to answer the questions that follow:

(i) Which company has sold the minimum number of units over the years?
Sol :- As per the above given table ,
The number of units sold by the company over the years:
Company A → Units sold ( In 2003 + In 2004 + In 2005 + In 2006 + In 2007 + In 2008 )
Company A → 110 + 118 +143 + 126 + 152 + 195 = 844
Company B → Units sold ( In 2003 + In 2004 + In 2005 + In 2006 + In 2007 + In 2008 )
Company B → 91 + 93 + 85 + 99 + 69 + 35 = 472
Company C → Units sold ( In 2003 + In 2004 + In 2005 + In 2006 + In 2007 + In 2008 )
Company C → 103 + 153 + 100 + 128 + 96 + 56 = 636
Company D → Units sold ( In 2003 + In 2004 + In 2005 + In 2006 + In 2007 + In 2008 )
Company D → 112 + 166 + 78 + 83 + 135 + 198 = 772
Company E → Units sold ( In 2003 + In 2004 + In 2005 + In 2006 + In 2007 + In 2008 )
Company E → 72 + 169 + 154 + 98 + 140 + 192 = 825
Company F → Units sold ( In 2003 + In 2004 + In 2005 + In 2006 + In 2007 + In 2008 )
Company F → 64 + 56 +120 + 70 + 176 + 54 = 540
Hence, company B has sold the minimum number of units over the years.
(ii) What is the average number of units sold (in crores) in the year 2007?
Sol :- From the above given table ,
In 2007 , the average number of units sold (in crores)
| = | ||
| Total number of companies |
| = | = | = 128 | ||
| 6 | 6 |
(iii) What is the difference between number of units (in crores) sold by company D in the year 2003 and the year 2005?
Sol :- On the basis of above given table ,
Required difference = Number of units ( In 2003 - In 2005 )
Required difference = 112 - 78 = 34 crores
(iv) Number of unit sold by company B in the year 2005 is what percent of the total number of units sold by all the companies together in the year?
Sol :- From the above given table ,
In 2005, total number of units sold by all the companies = Total number of units sold by ( Company A + Company B + Company C + Company D + Company E + Company F )
In 2005, total number of units sold by all the companies = 143 + 85 + 100 + 78 + 154 + 120 = 680
| Required percentage = | × 100 | |
| Total number of units sold by all the companies in 2005 |
| Hence, required percentage = | × 100 = 12.5% | |
| 680 |
(v) Which company has sold the maximum number of units over the years ?
Sol :- From the above given table ,
Total number of units sold by company A over the years = 110 + 118 + 143 + 126 + 152 + 195 = 844
Total number of units sold by company C over the years =103 + 153 + 100 + 128 + 96 + 56 = 636
Total number of units sold by company D over the years = 112 + 166 + 78 + 83 + 135 + 198 = 772
Total number of units sold by company E over the years = 72 + 169 + 154 + 98 + 140 + 192 = 825
Hence, company A has sold the maximum number of units over the years.
Example 3. Direction: Study the following table and answer the question given below:
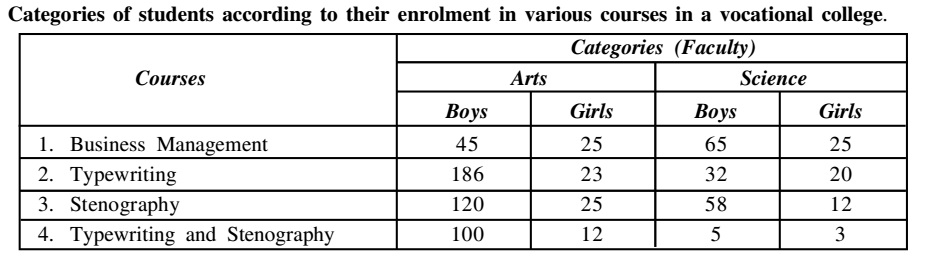
(i) If 60% boys and 70% girls pass in their respective courses, then total pass percentage is :
Sol :- Given in the above table,
∵ Total boys = 45 + 186 +120 +100 + 65 + 32 + 58 + 5 = 611
∴ Number of boys who pass in their respective courses = 60% of 611 =
| = 611 x | = 366.60 | |
| 100 |
Number of girls who pass in their respective courses = 70% of 145
| = 145 x | = 101.50 | |
| 100 |
| ∴ Combined pass percent = 100 x | = | = 61.92 = 62% | ||
| (611 + 145) | 756 |
(ii) Total number of boys studying in the college exceeds the total number of girls in the college by:
Sol :- As per the above given table , we can see that
Total number of boys = 45 + 65 + 186 + 32 + 120 + 58 + 100 + 5 = 611
Total number of girls = 25 + 23 + 25 + 12 + 25 + 20 + 12 + 3 = 145
| ∴ Required percentage = | x 100 ≈ 321% | |
| 145 |
(iii) In the art faculty number of students who have opted the course of stenography is how much percent of the total student in the faculty?
Sol :- As per the above given table , we have
| ∴ Required percentage = | x 100 = 100 ≈ 27% | |
| 536 |
(iv) The total number of students who have opted the course of Business Management and the course of Stenography exceeds the number of students studying in typewriting course by:
Sol :- As per the above given table ,
∵ Number of students in Business Management course = 160
Number of students in typewriting corse = 261
Number of students in stenography corse = 215
| ∴ Required percentage = | x 100 = 43.36 ≈ 27% | |
| 261 |
(v) In which of the following courses, percentage of girls is the highest?
Sol :- On the basis of above given table , we have
| ∴ Percentage of girls in Business Management course = | x 100 = 31.25 | |
| 160 |
| Percentage of girls in typewriting course = | x 100 = 16.47 | |
| 261 |
| Percentage of girls in stenography course = | x 100 = 12.56 | |
| 215 |
| And percentage of girls in typewriting and stenography course = | x 100 = 12.50 | |
| 120 |