Bar graph
Direction: The following bar graph depicts the result for BSc students of a college for 3 years. Read the graph and answer the questions based on this graph.
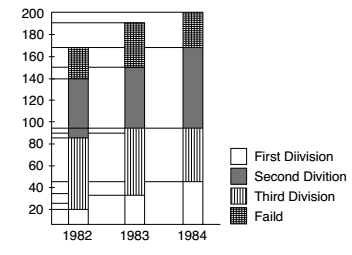
- The percentage of students passed in first division in 1982 was
-
View Hint View Answer Discuss in Forum
The percentage of students = Total passed students in first division in 1982 x 100 Total number of students in 1982 Correct Option: D
As per given Bar graph we can calculate that,
Total passed students in first division in 1982 = 20
Total number of students in 1982 = 170The percentage of students = Total passed students in first division in 1982 x 100 Total number of students in 1982 The percentage of students = 20 x 100 170 The percentage of students = 200 = 11 13 % 17 17
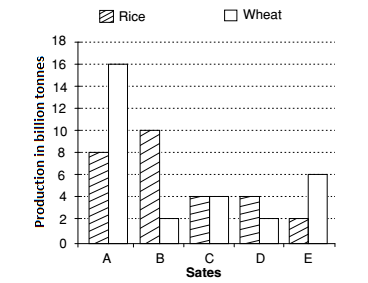
Direction: The bar graph provided below represents the production of rice and wheat in different states of a country in a certain year. Answer the question given below based on the bar graph.
- The state which is the largest producer of rice is :
-
View Hint View Answer Discuss in Forum
From the given Bar graph, we can see that the Highest graph for Rice in all state will give the maximum production of Rice.
Correct Option: B
From the given Bar graph, we can see that the Highest graph for Rice in all state will give the maximum production of Rice. The production of rice is the Highest in state B.
Hence the state B is the largest producer of rice .
i.e. State B ⇒ 10 Lakhs tonnes
- The ratio of total production of rice in the mentioned states to that of wheat in those states, is :
-
View Hint View Answer Discuss in Forum
Required ratio = Total production of Rice : Total production of Wheat
Correct Option: D
As per given bar graph , we can see that
Total production of rice in all state = (8 + 10 + 4 + 4 + 2) = 28 Lakhs tonnes
Total production of wheat in all state = (16 + 2 + 4 + 2 + 6) = 30 Lakhs tonnes
∴ Required ratio = Total production of Rice : Total production of Wheat
∴ Required ratio = 28 : 30 = 14 : 15
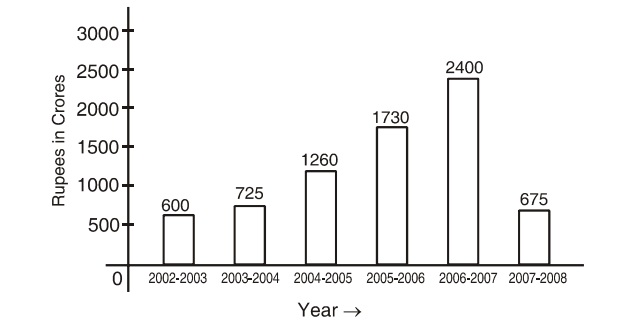
Direction: The following bar chart shows the amount accrued from additional taxation by the government during certain successive years. Study the chart carefully and answer the questions that follow:
- In between which of the following two successive finacial years increase in taxation was at the highest level?
-
View Hint View Answer Discuss in Forum
Between the financial years 2005-06 and 2006-07, maximum incresase of Rs. 670 cores had been registered in taxation.
Correct Option: B
Between the financial years 2005-06 and 2006-07, maximum incresase of Rs. 670 cores had been registered in taxation.
Direction: The bar graph provided below represents the production of rice and wheat in different states of a country in a certain year. Answer the question given below based on the bar graph.
- The difference between the production in rice and wheat is maximum in :
-
View Hint View Answer Discuss in Forum
As per given graph we can check that which state have the Highest graph for Rice and Lowest graph for Wheat.
Required Difference = The production of rice - The production of wheatCorrect Option: D
As per given graph we can check that which state have the Highest graph for Rice and Lowest graph for Wheat.
From above given graph ,
The production of rice in state A = 16 billion tonnes
The production of wheat in state A = 8 billion tonnes
The production of rice in state B = 10 billion tonnes
The production of wheat in state B = 2 billion tonnes
∴ Required Difference = The production of rice - The production of wheat
State A ⇒ (16 − 8) = 8 billion tonnes
State B ⇒ (10 − 2) = 8 billion tonnes
Hence Answer will be states A and B both .

