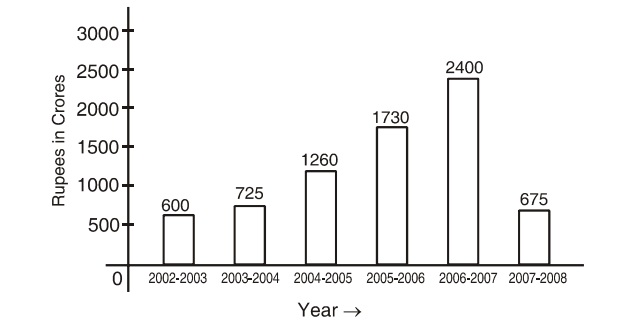
Direction: The following bar chart shows the amount accrued from additional taxation by the government during certain successive years. Study the chart carefully and answer the questions that follow:
-
In between which of the following two successive finacial years increase in taxation was at the highest level?
-
- 2002-2003 and 2003-04
- 2005-06 and 2006-07
- 2006-07 and 2007-08
- 2004-05 and 2005-06
Correct Option: B
Between the financial years 2005-06 and 2006-07, maximum incresase of Rs. 670 cores had been registered in taxation.

