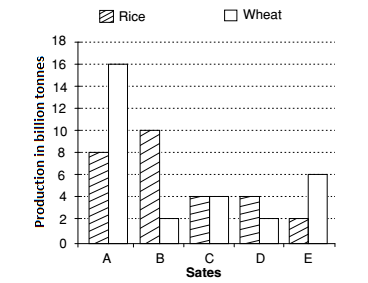
Direction: The bar graph provided below represents the production of rice and wheat in different states of a country in a certain year. Answer the question given below based on the bar graph.
-
The difference between the production in rice and wheat is maximum in :
-
- A only
- All of A, B and E
- B and E both
- A and B both
Correct Option: D
As per given graph we can check that which state have the Highest graph for Rice and Lowest graph for Wheat.
From above given graph ,
The production of rice in state A = 16 billion tonnes
The production of wheat in state A = 8 billion tonnes
The production of rice in state B = 10 billion tonnes
The production of wheat in state B = 2 billion tonnes
∴ Required Difference = The production of rice - The production of wheat
State A ⇒ (16 − 8) = 8 billion tonnes
State B ⇒ (10 − 2) = 8 billion tonnes
Hence Answer will be states A and B both .

