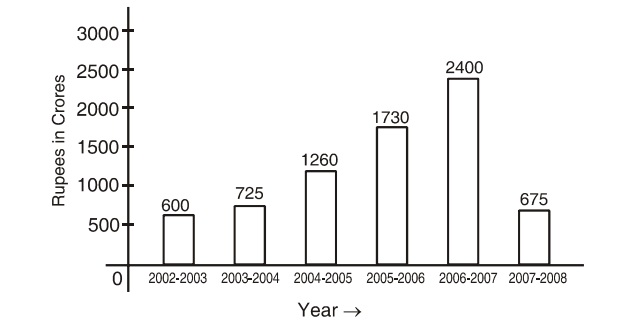
Direction: The following bar chart shows the amount accrued from additional taxation by the government during certain successive years. Study the chart carefully and answer the questions that follow:
-
Between the years 2005-06 and 2006-07 the taxation was increased by:
-
- RS . 670 crores
- RS . 650 crores
- RS . 700 crores
- RS . 715 crores
Correct Option: A
Increase in taxation in between the financial years 2005-06 and 2006-07
= Rs. (2400 - 1730) = RS. 670 crores

