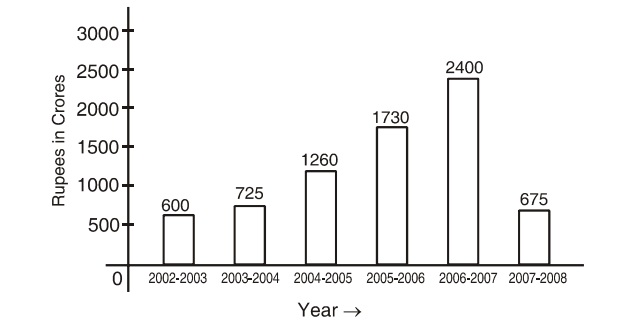
Direction: The following bar chart shows the amount accrued from additional taxation by the government during certain successive years. Study the chart carefully and answer the questions that follow:
-
Percentage decrease in taxation in between the years 2006-7 and 2007-08 was:
-
- 71.8%
- 68.8%
- 72.6%
- 75%
Correct Option: A
Percentage of total decrease in taxation between the years 2006-07 and 2007-08
= (2400 - 675/ 2400 x 100 = 1725 x 100/ 2400 = 71.8%

