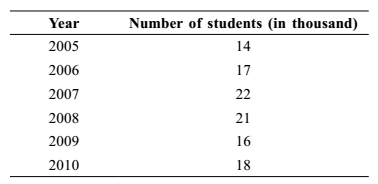
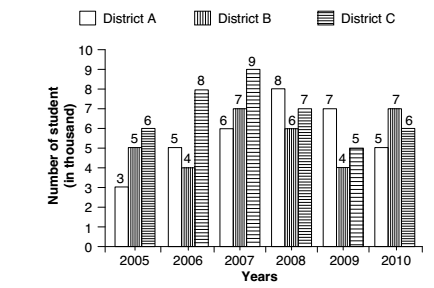
Direction: Study the following graph carefully to answer the questions that follow : Number of students (in thousand) enrolled in 3 different districts in 6 different years.
-
In which year was the number of students enrolled in all the three districts together the second highest?
-
- 2006
- 2007
- 2008
- 2009
- 2010
Correct Option: C
From given graph , we can see that
Since , In 2008 year is the number of students enrolled in all the given 3 districts together the second highest.
Hence required Answer will be 2008 year .