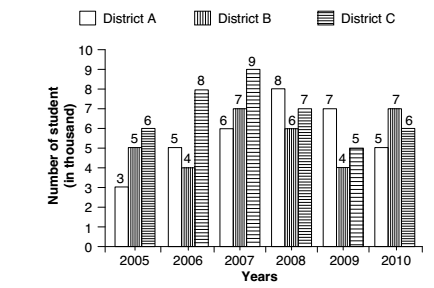
Direction: Study the following graph carefully to answer the questions that follow : Number of students (in thousand) enrolled in 3 different districts in 6 different years.
-
What was the percentage increase in enrollment in the number of students in District C in year 2007 as compared to that in the previous year?
-
- 115.5
- 112.5
- 15.5
- 12.5
- None of these
Correct Option: D
As per given graph, We have
Number of students in District C in year 2007 = 9
Number of students in District C in year 2006 = 8
Total change in enrollment = Students in District C in year 2007 - Students in District Cin year 2006
Total change in enrollment = 9 - 8 = 1
| ∵ Required Percentage = | Total change in enrollment | x 100 |
| Total number of students in District C in year 2006 |
| = | 1 x 100 | = 12.5 % |
| 8 |

