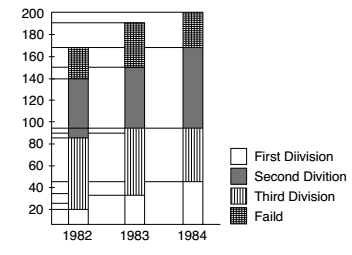
Direction: The following bar graph depicts the result for BSc students of a college for 3 years. Read the graph and answer the questions based on this graph.
-
The aggregate pass percentage during the 3 years was
-
-
82 44 % 113
-
82 55 % 113
-
80 60 % 113
-
77 29 % 113
-
Correct Option: C
As per given Bar graph we can see that,
Total passed students = 140 + 150 + 165 = 455
Total students = 170 + 195 + 200 = 565
| ∴ Required percentage = | Total passed students | x 100 |
| Total students |
| = | 455 | x 100 |
| 565 |
| = | 9110 | = | 80 | 60 | % | 113 | 113 |

