Bar graph
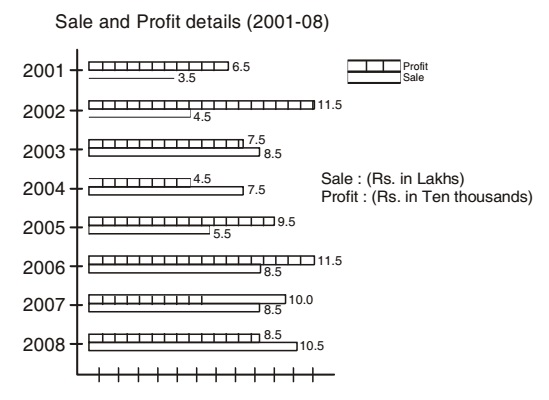
Direction: The bar graph as shows below gives information about the sale and profit details of a departmental store during the years from 2001 - 2008. Study the graph carefully and answer the questions asked here under.
- Annual mean profit of the store (rupees in ten thousand) is approximately:
-
View Hint View Answer Discuss in Forum
Annual mean profit of the store (rupees in ten thousands)
= Add the annual income of every years / difference of the yearCorrect Option: C
Annual mean profit of the store (rupees in ten thousands)
= (6.5 + 11.5 + 7.5 + 4.5 + 9.5 + 11.5 + 10.0 + 8.5)/8 = 69.5/8 =8.7 (approx.)
- Mean of annual increase in sale from 2003 to 2008 (rupees in lakhs) is:
-
View Hint View Answer Discuss in Forum
Mean of annual increase in sale from 2003 to 2008 = (Sale in 2008 - sale in 2003 )/ (Difference in years)
Correct Option: D
Mean of annual increase in sale from 2003 to 2008 = (Sale in 2008 - sale in 2003 )/ (Difference in years)
Mean of annual increase in sale from 2003 to 2008 = 10.5 - 8.5/ 5 = 0.4
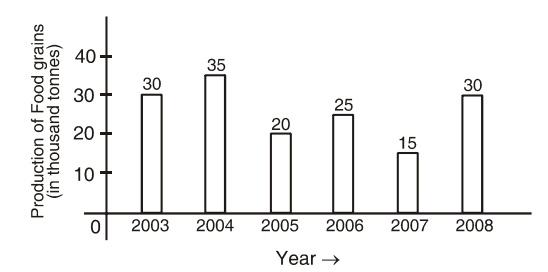
Direction: The following bar graph shows the producation of food grains in India during certain year. Study the graph carefully and answer the questions given below:
- Rate of change in quantity of production in which of the following two consecutive years is at the minimum level?
-
View Hint View Answer Discuss in Forum
Rate of change in the amount of production in the year 2004 over the year 2003 = (Production in 2004 - Production in 2003 ) x 100/ Production in 2003
Similarly
Rate of change in the amount of production in the year 2006 over the year 2005 = (Production in 2006 - Production in 2005 ) x 100/ Production in 2005Correct Option: A
Rate of change in the amount of production in the year 2004 over the year 2003 = (Production in 2004 - Production in 2003 ) x 100/ Production in 2003
Rate of change in the amount of production in the year 2004 over the year 2003 = (35 - 30) x 100 / 30 = 5 x 100 / 30 = 16.67%
Similarly
Rate of change in the amount of production in the year 2006 over the year 2005 = (25 - 20) x 100 / 20 = 5 x 100/20 = 25%
Rate of change in the amount of production in the year 2007 over the year 2008 = (30 - 15) x 100 / 15 = 15 x 100/15= 100%
Rate of change in the amount of production in the year 2006 over the year 2007 = (25 - 15) x 100 / 15 = 10 x 100/15= 66.67%
Hence, it is clear that the rate of change in the amount of production during the consecutive years 2007 and 2008 is at the highest level.
- Total food grain production in 2005 and 2007 is equal to the production during which of the following years?
-
View Hint View Answer Discuss in Forum
Total production in 2005 and 2007 = 20 + 15 = 35 thousand tonnes.
Correct Option: B
Total production in 2005 and 2007 = 20 + 15 = 35 thousand tonnes. This total production is equal to the production in the year 2004.
- Percentage increase in the production of foodgrains in the year 2008 over the year 2007 is:
-
View Hint View Answer Discuss in Forum
Percentage increase in food grain production = (30 - 15 )/15 x 100
Correct Option: D
Percentage increase in food grain production = (30 - 15 )/15 x 100 = 100%

