Bar graph
Direction: The following bar graph shows the producation of food grains in India during certain year. Study the graph carefully and answer the questions given below:
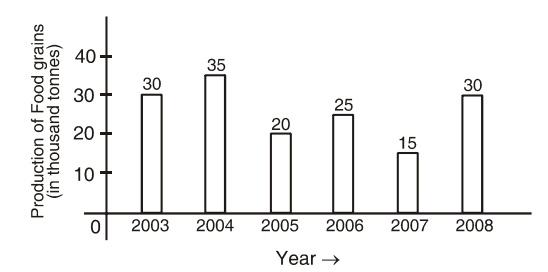
- The difference between the foodgrain productions of 2004 and 2008 is:
-
View Hint View Answer Discuss in Forum
Differnce between the production of foodgrains during 2004 and 2008 = 35 - 30 =5 thousand tonnes.
Correct Option: C
Differnce between the production of foodgrains during 2004 and 2008 = 35 - 30 =5 thousand tonnes.
Direction: Study the graph given below and answer the question asked there under.
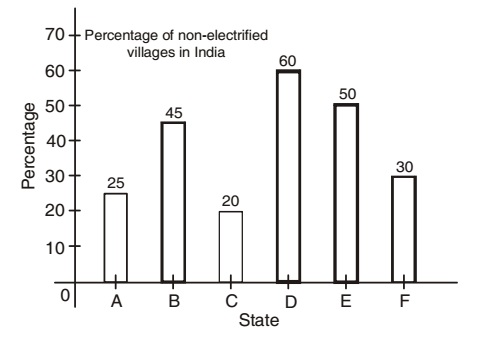
- According to the table given below which state of India has the highest percentage of electrified villages?
-
View Hint View Answer Discuss in Forum
In the state (C) percentage of non-electrified villages is the least.
Correct Option: C
In the state (C) percentage of non-electrified villages is the least. It means the percentage of electrified villages for the state (C) is the highest.
- If central govt. decides to extend financial assistance for prompt electrification and begins with the state having the least electrfied villages, then in the order of preference which of the following states will be fourth?
-
View Hint View Answer Discuss in Forum
The order of preference of the least electrified villages is given as: D, E, B, F, A. C.
Correct Option: C
The order of preference of the least electrified villages is given as: D, E, B, F, A. C.
Direction: The bar graph given here represents the number of persons killed in road accidents during rainy season in the year 2009. Study the graph carefully and answer the questions that follow:
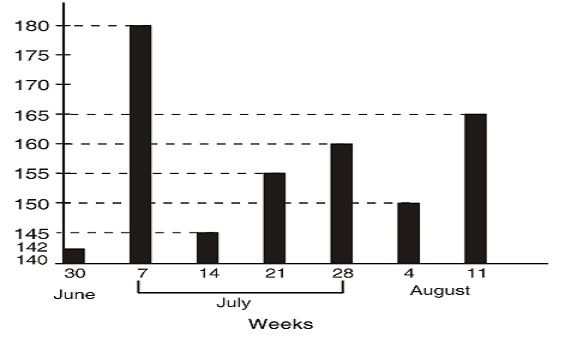
- In how many weeks number of persons killed was more than 150?
-
View Hint View Answer Discuss in Forum
According to the bar graph. number of person killed was more than 150 during the weeks beginning from 7 July, 21 July, 28 July and 11 August.
Correct Option: C
According to the bar graph. number of person killed was more than 150 during the weeks beginning from 7 July, 21 July, 28 July and 11 August. Therefore number of such weeks = 4.
- In how many weeks number of persons killed was less than 150?
-
View Hint View Answer Discuss in Forum
Calculate from the bar graph that during the weeks beginning from 30 June. 14 July and 4 August.
Correct Option: B
It is obvious from the bar graph that during the weeks beginning from 30 June. 14 July and 4 August, number of person killed remained less than 150.

