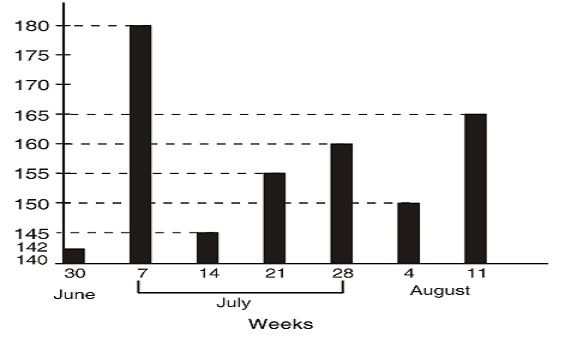
Direction: The bar graph given here represents the number of persons killed in road accidents during rainy season in the year 2009. Study the graph carefully and answer the questions that follow:
-
In how many weeks number of persons killed was less than 150?
-
- 2
- 0
- 1
- 3
Correct Option: B
It is obvious from the bar graph that during the weeks beginning from 30 June. 14 July and 4 August, number of person killed remained less than 150.

