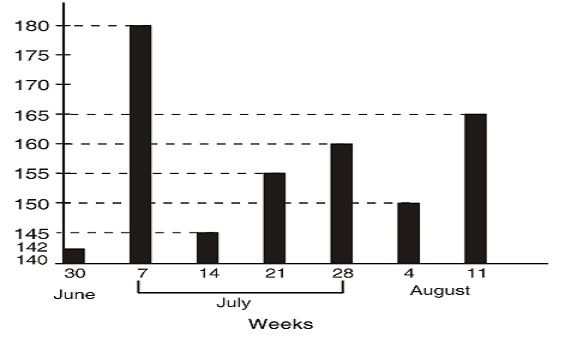
Direction: The bar graph given here represents the number of persons killed in road accidents during rainy season in the year 2009. Study the graph carefully and answer the questions that follow:
-
During which of the following successive weeks number of persons killed came down to a minimum level?
-
- 28 July - 4 August
- 7 July - 14 July
- 30 June - 7 July
- 21 July - 28 July
Correct Option: B
According to the bar graph, two successive weeks, i.e. 7 July - 14 July shows maximum decline in the number of persons of killed in road accidents.

