Bar graph
Direction: Study the bar diagram and answer questions based on it.
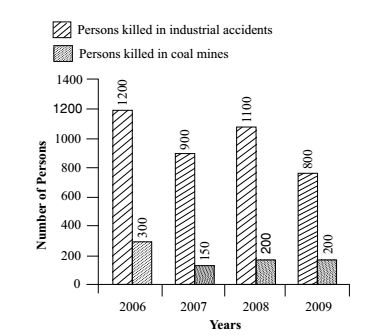
- The number of persons killed in coal mines in 2006 was what percent of those killed in industrial accidents in that year?
-
View Hint View Answer Discuss in Forum
Required percentage = The number of persons killed in coal mines in 2006 X 100% The number of persons killed in industrial accidents in 2006
Correct Option: B
As per given graph , we can see that
The number of persons killed in coal mines in 2006 = 300
The number of persons killed in industrial accidents in 2006 = 1200∴ Required percentage = The number of persons killed in coal mines in 2006 X 100% The number of persons killed in industrial accidents in 2006 ∴ Required percentage = 300 X 100% = 25% 1200
Direction: Study the information given in each of these questions and then answer the questions.
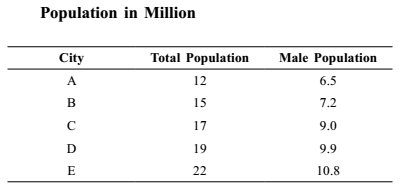
- What is the average female population in million?
-
View Hint View Answer Discuss in Forum
Average female population = sum of total numbers of females total number of cities
Correct Option: A
From above given table , we can see that
The total population of all cities = 12 + 15 + 17 + 19 + 22 = 85 million
Total males in all cities = 6.5 + 7.2 + 9.0 + 9.9 + 10.8 = 43.4 million
Total females = 85 – 43.4 = 41.6 millionAverage female population = sum of total numbers of females total number of cities = 41.6 = 8.32 million 5
- The area of the circle is 616 cm2. What is the area of the rectangle?

-
View Hint View Answer Discuss in Forum
∵ Area of the circle = πr2
Required Area of the rectangle = Length x BreadthCorrect Option: C
given :- Area of the circle = 616
⇒ πr2 = 616
Put the value of π = 22/7 in above equation.
we will get,
⇒ r2 = 196
⇒ r = 14 cm
Length of the rectangle = Diameter of the circle = 2r
Breadth of the rectangle = Radius of the circle = r
∴ Area of the rectangle = Length x Breadth
∴ Area of the rectangle = 28 × 14 = 392 cm2
Direction: Study the graph given below and answer the question asked there under.
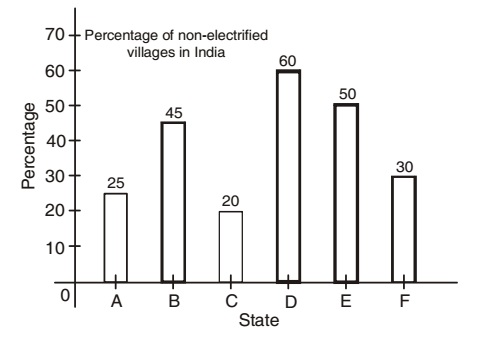
- What is the precentage of electrified villages in the state (A)?
-
View Hint View Answer Discuss in Forum
Percentage of electrified villages in the state A = 100 - 25 .
Correct Option: D
Percentage of electrified villages in the state A = 100 - 25 = 75%
- In which of the following states percentage of electrified villages is double the percentage of electrified villages in state (D)?
-
View Hint View Answer Discuss in Forum
Percentage of electrified villages in state D = 100 - 60
Percentage of electrified villages in state C = 100 - 20Correct Option: A
Percentage of electrified villages in state D = 100 - 60 = 40
Percentage of electrified villages in state C = 100 - 20 = 80
Hence, the percentage of electrified villages in the state C is double the percentage of electrified villages in state D.

