Bar graph
Direction: Study the bar diagram and answer questions based on it.
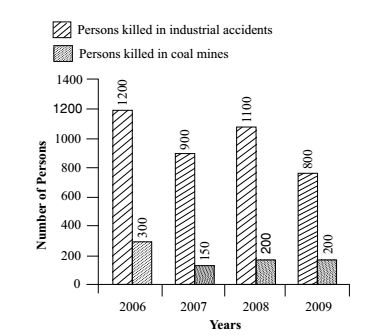
- The number of persons killed in coal mines in 2006 was what percent of those killed in industrial accidents in that year?
-
View Hint View Answer Discuss in Forum
Required percentage = The number of persons killed in coal mines in 2006 X 100% The number of persons killed in industrial accidents in 2006
Correct Option: B
As per given graph , we can see that
The number of persons killed in coal mines in 2006 = 300
The number of persons killed in industrial accidents in 2006 = 1200∴ Required percentage = The number of persons killed in coal mines in 2006 X 100% The number of persons killed in industrial accidents in 2006 ∴ Required percentage = 300 X 100% = 25% 1200
- In which year, minimum number of persons killed in industrial accidents and coal mines together?
-
View Hint View Answer Discuss in Forum
From the above given figure , the minimum number of persons killed in industrial accidents and coal mines are ( 800 + 200 ) = 1000 in 2009
Correct Option: D
From the above given figure , the minimum number of persons killed in industrial accidents and coal mines are ( 800 + 200 ) = 1000 in 2009
Hence the minimum number of persons were killed = 1000 (In 2009)
- In which year, maximum number of persons were killed in industrial accidents other than those killed in coal mines?
-
View Hint View Answer Discuss in Forum
From the above given figure , we can see that
The maximum number of persons killed in industrial accidents are 1200 in 2006Correct Option: A
From the above given figure , we can see that
The maximum number of persons killed in industrial accidents are 1200 in 2006
Hence the maximum number of persons were killed in industrial accidents = 1200 (in 2006)
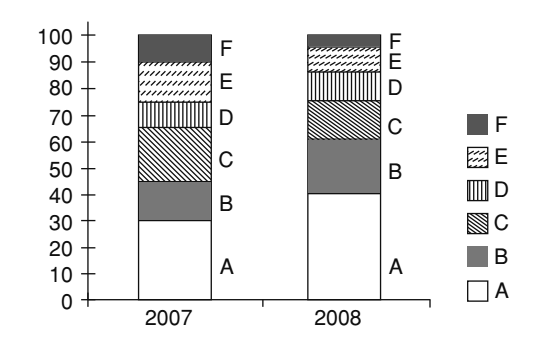
Direction: The bar chart given below shows the % distribution of the production of various models of a mobile manufacturing company in 2007 and 2008. The total production in 2007 was 35 Lakh mobile phones and in 2008 the production was 44 Lakhs.
Study the chart and answer the following questions. % of 6 different types of mobiles manufactured by a company over 2 years.
- If the percentage production of A type mobiles in 2008 was same as that in 2007, then the number of A type mobiles produced in 2008 would have been
-
View Hint View Answer Discuss in Forum
Required Production = The total production in 2008 x % 0f production of A type mobiles in 2007
Correct Option: B
Given:- The total production in 2008 = 44 Lakh
Percentage of production of A type mobiles in 2007 = 30%
Required Production = Percentage of production of A type mobiles in 2007 x The total production in 2008
= 30% of 44Required Production = 44 x 30 = 13,20,000 Million 100
- For which models was the percentage variation in production from 2007 to 2008 the maximum?
-
View Hint View Answer Discuss in Forum
In Model ,
Percentage Variation= Total increase x 100% Production in 2008
Correct Option: D
As per given table , we can see that
For A , Production in 2007 = 40 , Production in 2008 = 30
Total increase = Production in 2007 - Production in 2008
= 40 - 30 = 10
In Model ,
Percentage Variation= Total increase x 100% Production in 2008 Model A ⇒ 10 x 100 = 33 1 30 3
Simillarly , For B , Production in 2007 = 20 , Production in 2008 = 15
Total increase = Production in 2007 - Production in 2008
= 20 - 15 = 5Model B ⇒ 5 x 100 = 33 1 15 3
For C , Production in 2007 = 15 , Production in 2008 = 20
Total increase = Production in 2007 - Production in 2008
= 15 - 20 = -5Model C ⇒ -5 x 100 = - 25 20
Hence required answer will be A and B models.

