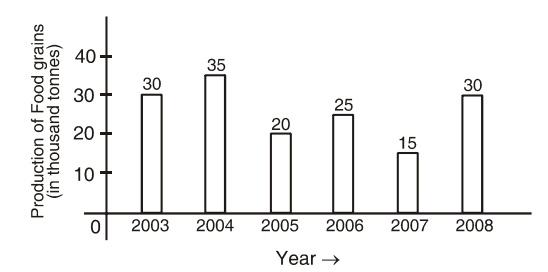
Direction: The following bar graph shows the producation of food grains in India during certain year. Study the graph carefully and answer the questions given below:
-
Total food grain production in 2005 and 2007 is equal to the production during which of the following years?
-
- 2003
- 2004
- 2006
- 2008
Correct Option: B
Total production in 2005 and 2007 = 20 + 15 = 35 thousand tonnes. This total production is equal to the production in the year 2004.

