Logical Venn Diagram
Direction: In each of the following questions, identify the diagram that best represents the relationship among classes given below :
- Government Servants, Lecturers and Doctors
-
View Hint View Answer Discuss in Forum
On the basis of above given question , we can say that
Some lecturers may be doctors and vice-versa.
Some Government servants may be lecturers and vice-versa.
Some Government servants may be doctors and vice-versa.
Some Government servants who are lecturers may be doctors.
Some doctors who are lecturers may be Government servants.Correct Option: D
On the basis of above given question , we can say that
Some lecturers may be doctors and vice-versa.
Some Government servants may be lecturers and vice-versa.
Some Government servants may be doctors and vice-versa.
Some Government servants who are lecturers may be doctors.
Some doctors who are lecturers may be Government servants.
Therefore , option ( D ) represents the best relationship between Government Servants, Lecturers and Doctors. As shown in given venn - diagram .
- Children, Serious and Naughty
-
View Hint View Answer Discuss in Forum
As per the given above question , we can say that
Some children may be serious.
Some children may be naughty.
Naughty is different serious.Correct Option: A
As per the given above question , we can say that
Some children may be serious.
Some children may be naughty.
Naughty is different serious.
From above it is clear that option ( A ) represents the best relationship between Children, Serious and Naughty. As shown in given venn - diagram .
- M .K. Gandhi, Umesh Chandra Bandhopadhyay, Jatin Das and Surya Sen
-
View Hint View Answer Discuss in Forum
As we know that ,
MK Gandhi, Umesh Chandra Bandopadhyay, Jatin Das and Surya Sen, are different persons.Correct Option: B
As we know that ,
MK Gandhi, Umesh Chandra Bandopadhyay, Jatin Das and Surya Sen, are different persons.
From above it is clear that option ( B ) represents the best relationship between M .K. Gandhi, Umesh Chandra Bandhopadhyay, Jatin Das and Surya Sen. As shown in given venn - diagram .
- Which of the following diagrams illustrate the relationship among Science, Maths and Biology?
-
View Hint View Answer Discuss in Forum
According to above given question , we can say that
Biology comes under the class science.
But, Mathematics is different from the both.Correct Option: A
According to above given question , we can say that
Biology comes under the class science.
But, Mathematics is different from the both.
Thus, option A is required answer .
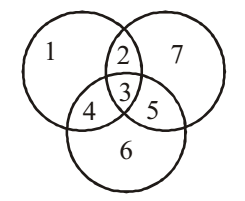
- In the given figure, circles represent students studying 3 different subjects. How many students study all the 3 subjects?
-
View Hint View Answer Discuss in Forum
From above given diagram , we can say that
The number ‘3’ is common to all the three circles.Correct Option: B
From above given diagram , we can say that
The number ‘3’ is common to all the three circles.
Hence , 3 students study all the three subjects .

